IA modelling, step by step · comparing models
Choosing and comparing models: residuals, R², SSR and testing
A good modelling IA does not just fit a curve — it argues for one. This page fits four models to the same data, compares them in four different ways, and shows the one that fits best is not always the one to choose.
Example data, invented for this guide. The context is realistic, but the numbers were made up to show the method. Use your own measured or sourced data in your IA.
The data and four candidates
A student learning to touch-type records their speed on a 1-minute test at the end of chosen practice days. From the shape (rising, bending over) and the context (skill improves quickly, then more slowly), four candidates are reasonable: a line as the baseline, a quadratic, a logarithmic model and a power model.
| i | x: Day of practice | y: Typing speed (words per minute) |
|---|---|---|
| 1 | 1 | 18 |
| 2 | 2 | 25 |
| 3 | 3 | 27 |
| 4 | 5 | 33 |
| 5 | 7 | 35 |
| 6 | 10 | 39 |
| 7 | 14 | 41 |
| 8 | 20 | 45 |
| 9 | 28 | 48 |
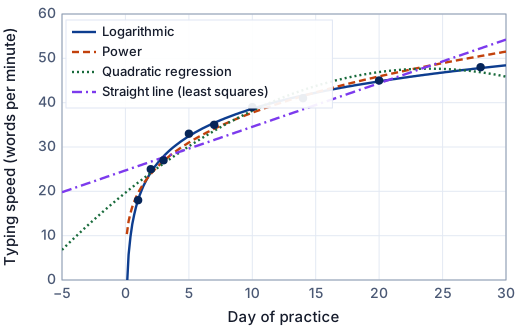
1. How well does each fit? SSR, R² and RMSE
| Model | Parameters | SSR | R² | RMSE |
|---|---|---|---|---|
| Logarithmic | 2 | 2.440 | 0.9969 | 0.521 |
| Power | 2 | 17.76 | 0.9771 | 1.40 |
| Quadratic regression | 3 | 35.96 | 0.9537 | 2.00 |
| Straight line (least squares) | 2 | 130.0 | 0.8325 | 3.80 |
On these numbers alone the logarithmic fits best (lowest SSR), with the power close behind. But the table is only the start.
Why R² can mislead
- R² can only go up when you add parameters: a quadratic always has at least the R² of a line, a cubic at least that of a quadratic. Compare models with the same number of parameters, or account for the extra ones.
- For models fitted after a transformation (ln y, ln x and ln y), a calculator's r or R² describes the straight line in the transformed units, not the fit to your original data. Compute SSR in the original units (as in the table above) to compare fairly.
- For non-linear models, R² = 1 − SSR/SST is still a useful summary, but it no longer equals the square of a correlation coefficient and it can mislead for curves that do not include a constant term. Treat it as one piece of evidence.
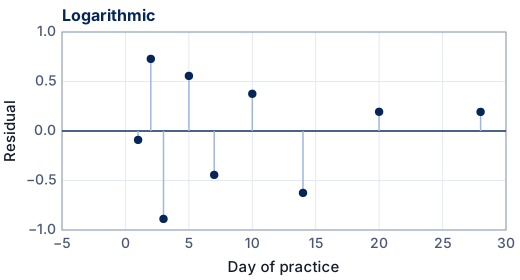
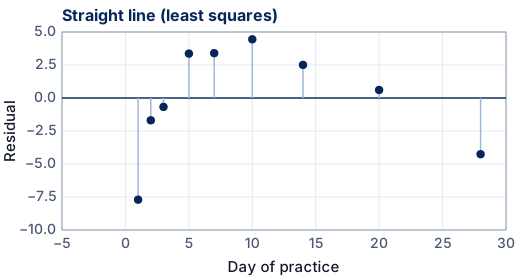
- A high R² does not show the shape is right. The line above has R² = 0.8325 — high-looking — yet its residuals show a clear pattern.
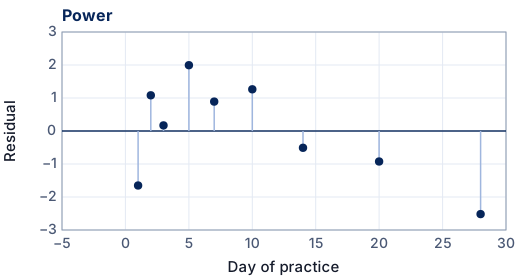
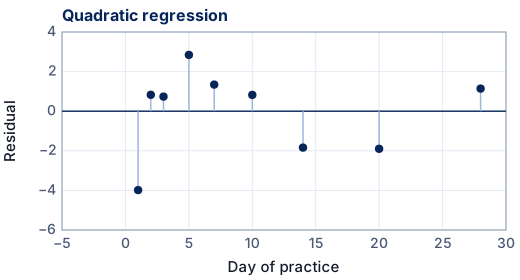
2. Look at the residual plots
A model has captured the shape when its residuals look like random scatter about zero. A curve, a trend or a funnel shape in the residuals is information the model has missed.
3. Test on points you did not use
Hold back the last 2 points, fit each model to the other 7, and predict the held-out ones. This tests what matters for most IAs: can the model predict?
| Model | Parameters | SSR (fitted points) | R² | RMSE | SSR (held-out points) | RMSE (held-out) |
|---|---|---|---|---|---|---|
| Logarithmic | 2 | 2.262 | 0.9944 | 0.568 | 0.4278 | 0.463 |
| Power | 2 | 10.10 | 0.9750 | 1.20 | 38.99 | 4.42 |
| Straight line (least squares) | 2 | 54.67 | 0.8650 | 2.79 | 440.1 | 14.8 |
| Quadratic regression | 3 | 9.644 | 0.9762 | 1.17 | 2126 | 32.6 |
| Model | ŷ at x = 20 (data 45) | ŷ at x = 28 (data 48) |
|---|---|---|
| Logarithmic | 44.56 | 47.52 |
| Power | 48.15 | 53.39 |
| Straight line (least squares) | 53.95 | 66.98 |
| Quadratic regression | 32.24 | 3.687 |
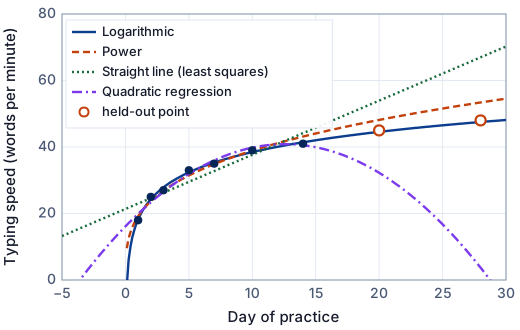
The logarithmic predicts the held-out points best. The quadratic, which fitted the data almost as well as the logarithm, predicts a fall in typing speed (3.687 wpm on day 28) — because a parabola must turn round. A good fit inside the data said nothing about that.
4. Extrapolation and the domain
- Every model is fitted on a domain: here 1 ≤ x ≤ 28 days. Say so, in set or inequality notation.
- Inside the domain (interpolation), predictions are about as reliable as the RMSE suggests. Outside it (extrapolation), models that agree on the data can disagree wildly: on day 60 the logarithmic model predicts 54.6 wpm, the power model 62.7 wpm and the quadratic −15.7 wpm.
- Use the context to decide which extrapolation is believable, and say how far you would trust it.
- A model that must be wrong in the long run (a logarithm that never stops rising, a quadratic that turns down) can still be the best model for the domain you studied — say both things.
5. Choose, and justify the choice
- Shape and context first. Discard candidates whose shape cannot match the situation (an asymptote in the wrong place, a turning point that cannot exist).
- Residuals. Prefer the model whose residual plot shows no pattern.
- SSR (or R²) with the number of parameters. A small improvement bought with an extra parameter is not convincing; a large one may be.
- Prediction. Prefer the model that predicts held-out or new data best.
- Meaning. Prefer parameters you can interpret in the context (a rate, a half-life, a period, an asymptote).
Here every test points the same way: the logarithmic model (SSR 2.440 on all the data, against 35.96 for the quadratic with one more parameter). When the tests disagree, say so and explain which you weight most for your question.
What SL and HL examiners expect
| Level | A strong modelling IA typically… |
|---|---|
| SL (AA and AI) | Justifies two or three candidate models, shows at least one fit by hand (simultaneous equations, completing the square, a Σ-table regression or a log linearisation), uses technology for the rest with a clear explanation, compares the models with SSR/R² and residuals, and interprets the parameters and the domain. |
| HL (AA and AI) | Does all of that with more of the mathematics shown or derived: least squares by calculus (normal equations), logarithms to justify linearisations, iterative refinement explained, testing on held-out data, sensitivity of the parameters to the choices made, or a model derived from a differential equation and then fitted. |
Our summary, not the IB's wording. Criterion E (use of mathematics) is the only criterion that differs between SL and HL; see Criterion E and how the IA differs by course. The comparison itself is largely Criterion D (reflection): Criterion D.
Is your comparison good enough?
- Each candidate model is justified before it is fitted.
- Every model is compared on the same data, in the same (original) units.
- Residual plots are shown and discussed, not only R².
- The number of parameters is taken into account.
- At least one test on data not used for fitting, or a clear reason why that was not possible.
- The chosen model's domain and limitations are stated, and extrapolation is discussed.
Frequently asked questions
Should I choose the model with the highest R²?
Not automatically. R² rises with extra parameters and can mislead for transformed or non-linear fits. Use it together with residual plots, SSR in the original units, the number of parameters, the context and a test on data you did not fit.
What is a residual plot?
A graph of the residuals (data minus model) against x. If the model has captured the shape, the points scatter randomly about zero; a curve or trend means it has missed something.
How do I test a model on data I did not use?
Hold back one or two points (or collect extra ones), fit the model to the rest, and compare its predictions with the held-back values. Report the errors, for example as a sum of squared errors.
Free: the IA checklist an examiner uses
Every check for Criteria A–E in a 4-page PDF, the mistakes that cost the most marks and a self-assessment grid. We'll email it with a short IA tip every few days, timed to your deadline if you give it. Free — no account, no payment.
While you wait for the email: read the full modelling workflow →