IA modelling · interactive helper
Model my data: the play-by-play with your numbers
Paste your x and y values, choose a model and see every step of the method with your own numbers: parameters, working, residuals, R², SSR and a graph. Then compare several models, including a test on points held back.
Private by design: the calculations run in your browser. Nothing you type is sent to our server unless you sign in and press Save — then only what you save is kept in your account, and you can delete it any time.
My saved models
Sign in to save named datasets and models to your account, then reopen, rename or delete them here.
Works with Desmos, GeoGebra and spreadsheets
Already have your data in Desmos, GeoGebra, Google Sheets or Excel? Paste it straight into Model my data for the step-by-step method with your numbers, then send the model back.
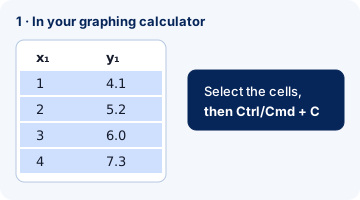
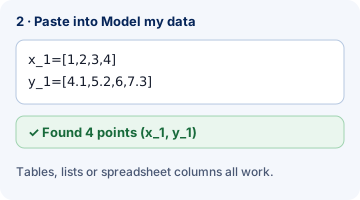
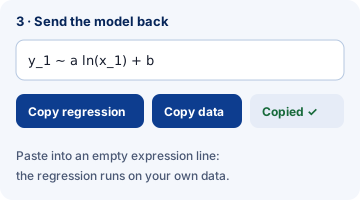
Copy the table cells (or the lists x_1=[…] and y_1=[…]) → paste into the helper → copy the data, the Desmos regression, a GeoGebra command or a CSV back. Nothing is uploaded: it goes through your clipboard. Desmos is a trademark of Desmos Studio PBC and GeoGebra a trademark of GeoGebra GmbH; IB Math Revision is not affiliated with or endorsed by either.
How the helper works
- Straight lines and anything that can be made straight (logarithmic, reciprocal, exponential, power) are fitted by the least-squares formulas, shown with the Σ table — the same as a GDC.
- Quadratics through three points are solved by elimination; quadratic and cubic regressions by least squares.
- Sine and logistic models start from the by-hand estimates on the worked pages and are refined by the Levenberg–Marquardt method (an improved Gauss–Newton method), which is how calculators fit them too.
- Every model reports residuals, SSR, R² and RMSE in the original units, so different models can be compared fairly.
Each model has a worked page explaining the method in full: straight line, quadratic, sinusoidal, logarithmic, reciprocal, exponential, power, logistic, cubic and polynomials, piecewise, and choosing and comparing models.
Frequently asked questions
Can I use this helper for my IA?
Use it to learn the method and to check your own working. Your IA must show your own working and explanations; acknowledge the helper if you used it, as your school's policy requires, and never paste its output into your IA.
Is my data uploaded or saved?
Only if you choose to save it. Everything is calculated in your browser by a small script. Nothing you type is sent to our server unless you are signed in and press Save; then the name, the data, the axis labels and the model you chose are kept in your account so you can reopen them, and you can rename or delete them at any time under My saved models. Deleting removes them from our database.
Why do my calculator's numbers differ slightly?
For exponential and power models a GDC fits a straight line to the logs, while direct least squares (Desmos's default) minimises errors in y itself; the helper shows both. For sine and logistic fits, iterative methods can stop at slightly different values or give an equivalent form.