For: Student · 4 steps
How to use the IA modelling helper
Model my data works through the method for fitting a model with your own numbers, so you can learn it and check your working. It is a checking aid: your IA must show your own working and explanations.
The screenshots are of the real site with a made-up demo school: every name in them is fictional.
Open Model my data →-
Enter your data
Open Model my data. Paste two columns from a spreadsheet or type x, y pairs one per line; lists copied from Desmos are read too. Add axis labels, or load example data to try it first.
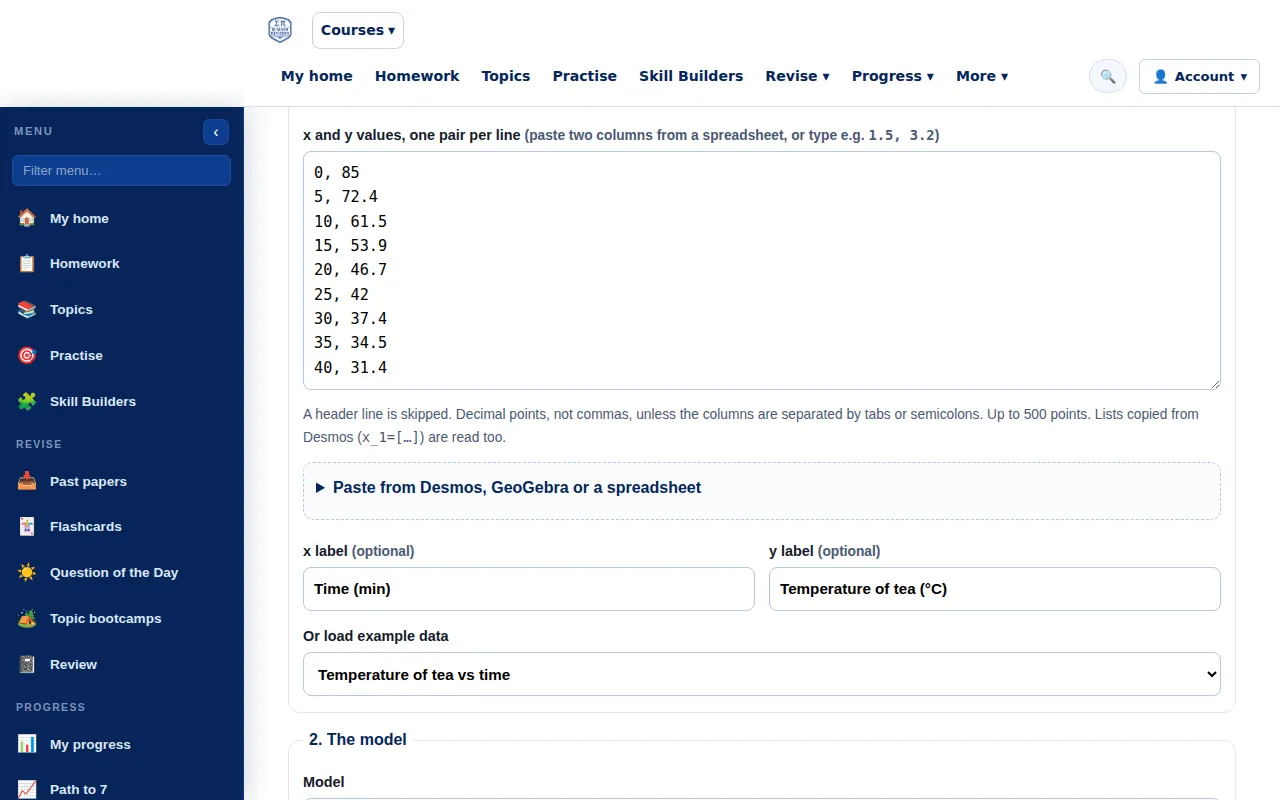
Step 1: Model my data with temperature of tea against time entered as x and y values. Full size -
Choose a model and show the steps
Choose a model, such as exponential, and press Show the steps. The helper works through the method with your numbers and shows the fitted graph, the residuals, SSR, R² and RMSE.
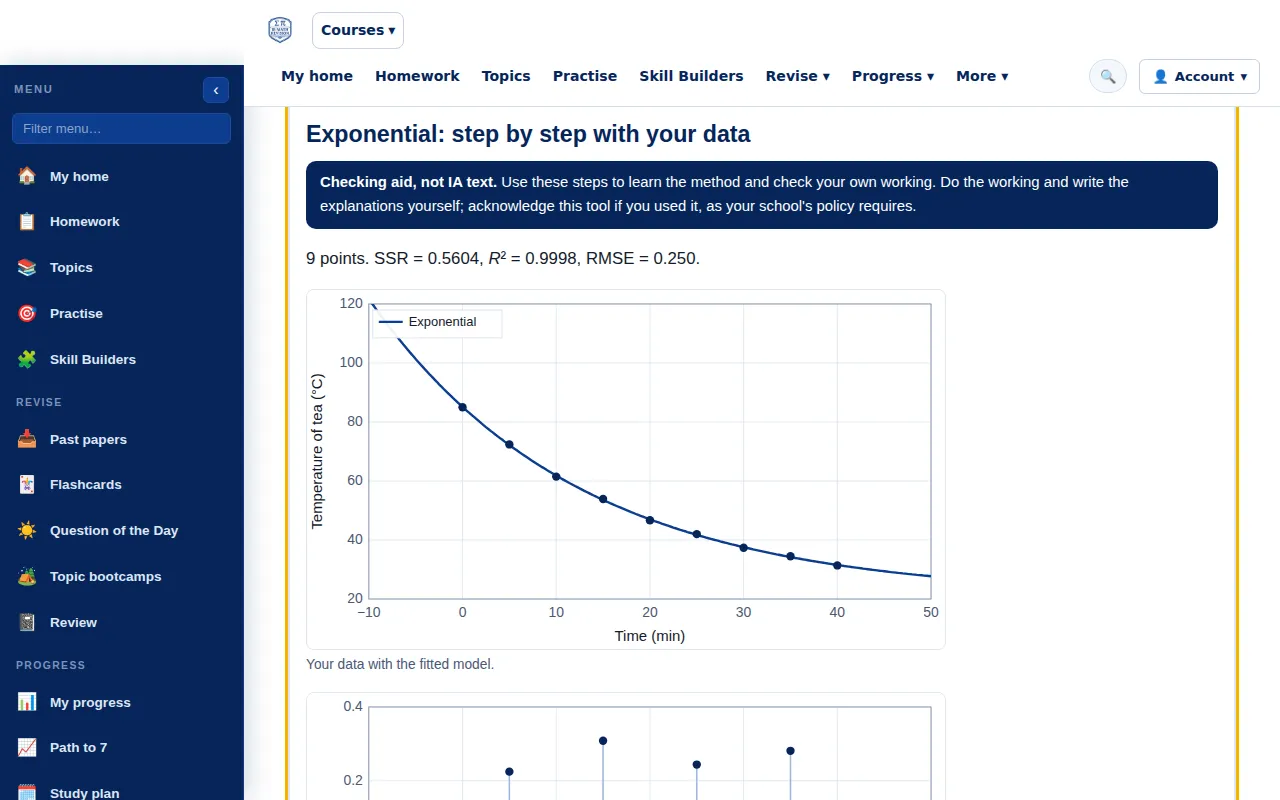
Step 2: An exponential model fitted step by step to the demo data with its graph and R squared. Full size -
Compare models
Compare models fits each model and tests it on the last points you hold back (2 by default), so you can see which one predicts new data best, not only which fits best.
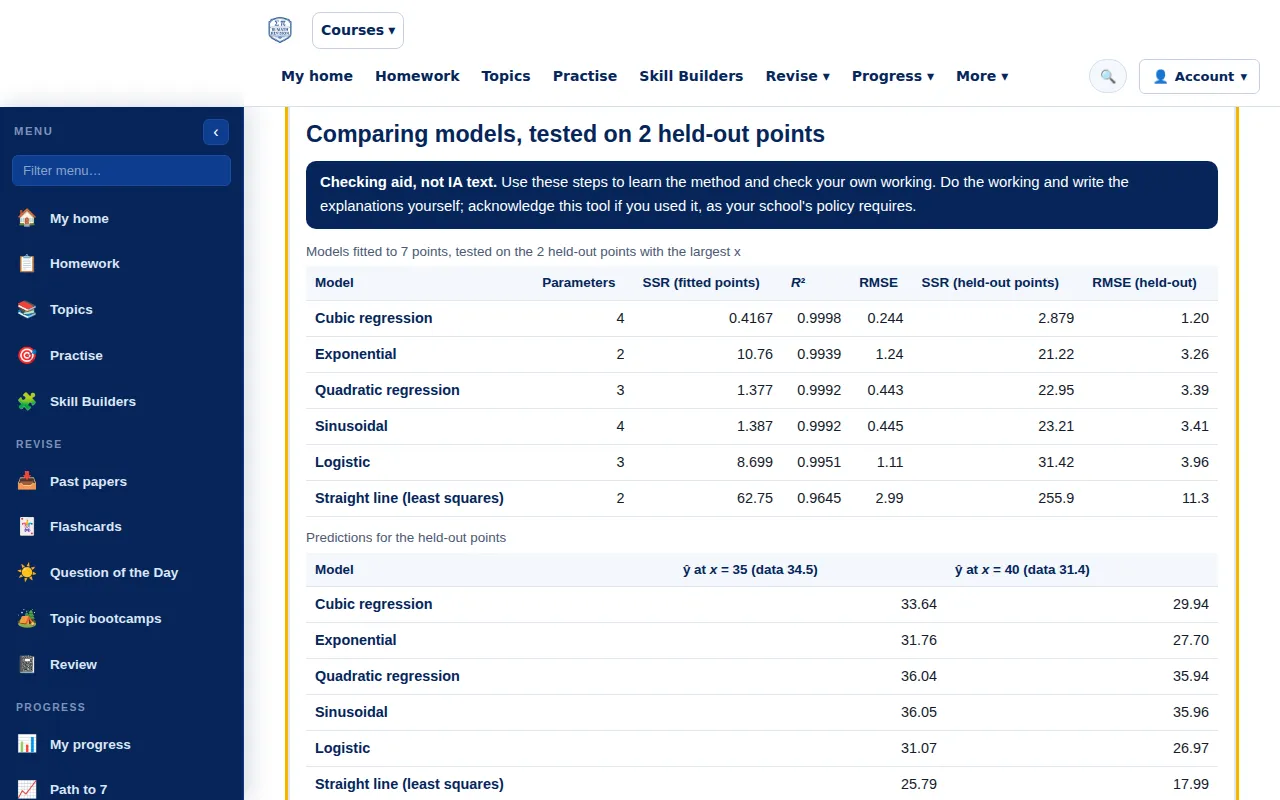
Step 3: Comparison table of cubic, exponential, quadratic, sinusoidal, logistic and straight-line models on held-out points. Full size -
Save your model
Signed in, press Save to keep the data and model under My saved models, to reopen, rename or delete later. If your teacher has set an IA modelling task, they can see your saved models on the class page while it is set.
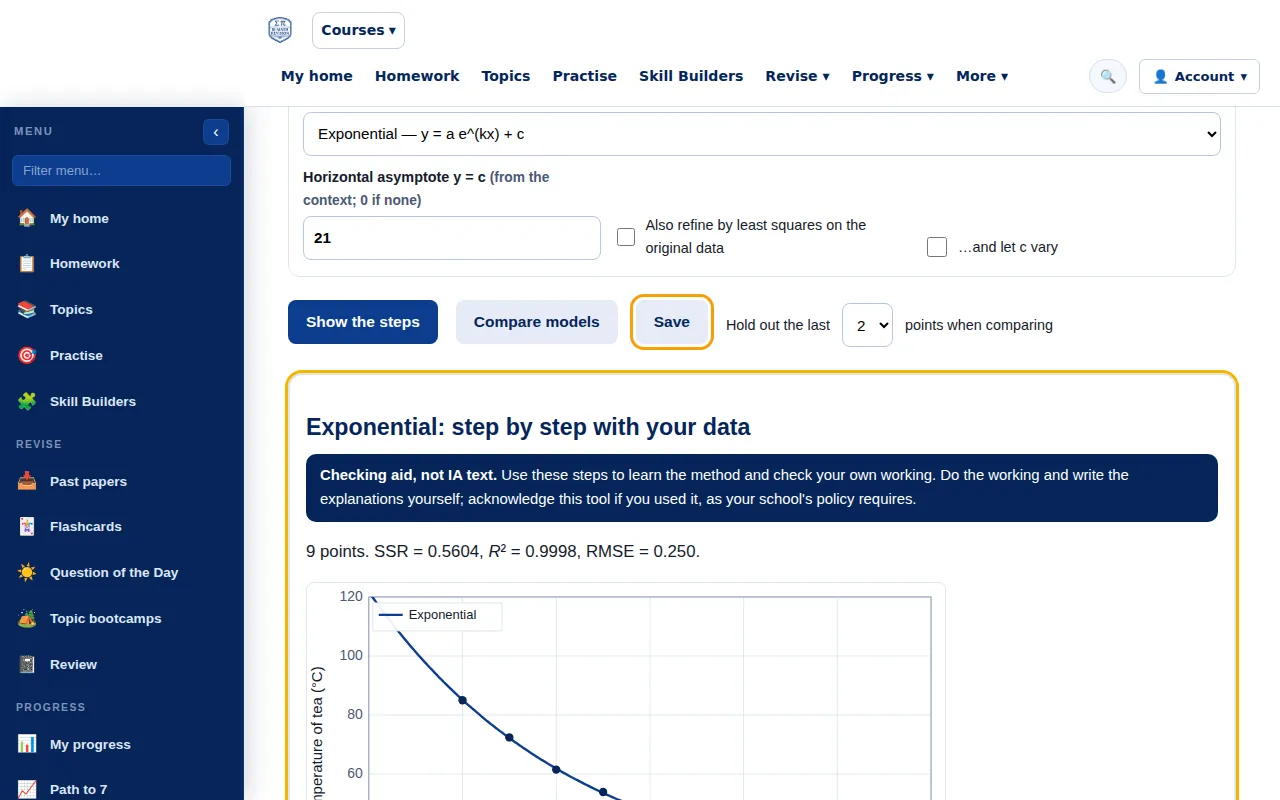
Step 4: The Save button ringed under the model choice, above the step-by-step working. Full size
Good to know
- Acknowledge the helper in your IA if you used it, as your school's policy requires. See how to use help and AI honestly.
- Each model has a worked page, for example the exponential model; the IA hub has the rest of the IA tools.