For: Student · 5 steps
How to use the free graphing calculator
The Grapher is free and needs no sign-in. It plots functions, sliders and tables, fits models to data for your IA and exports a graph for slides, documents or a web page.
The screenshots are of the real site with a made-up demo school: every name in them is fictional.
Open the Grapher →-
Type a function
Open the Grapher and type in the first line, for example
y = x^2 - 2x - 3. Add more lines with + Expression, + Table, + Note or + Image.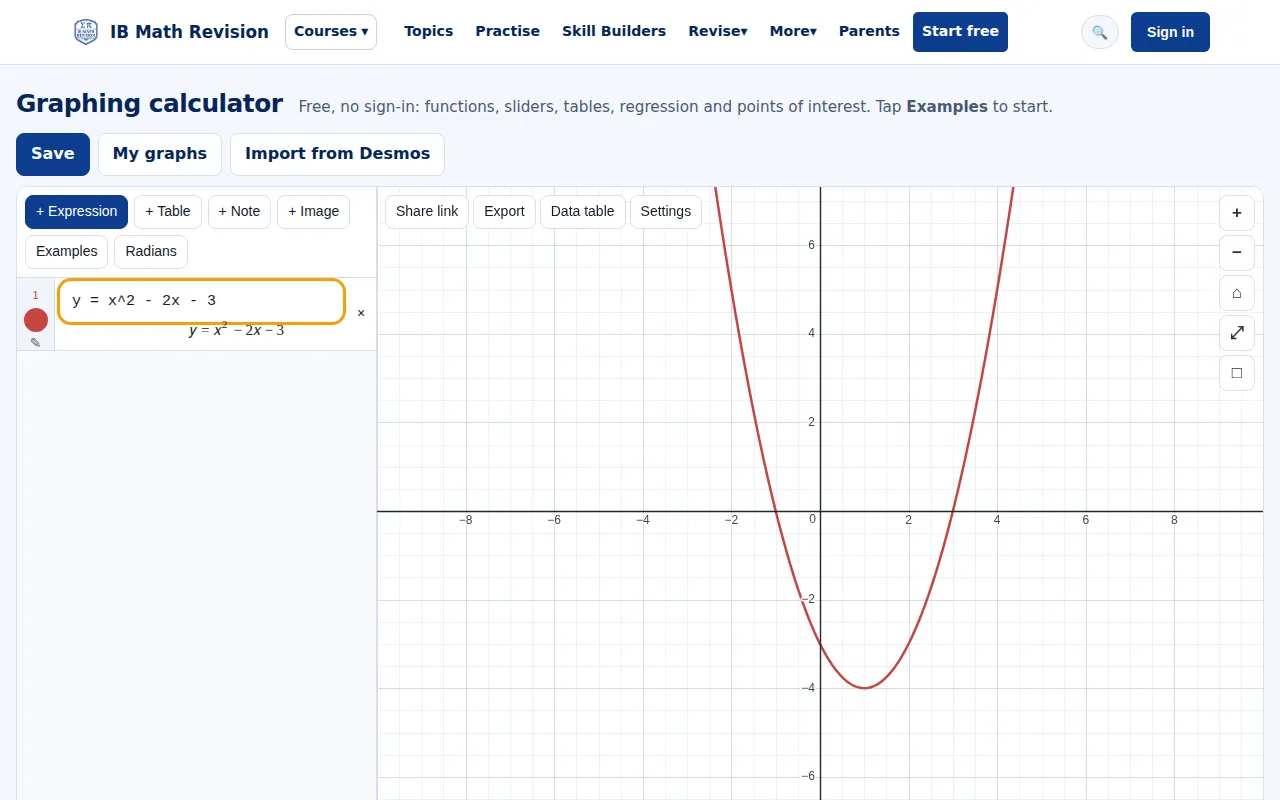
Step 1: Graphing calculator plotting y equals x squared minus 2x minus 3 with the expression line ringed. Full size -
Start from an example
Press Examples for ready-made graphs by task, including IA modelling regressions. Tap one to load it and change the numbers. It replaces your current graph, so press Share link first to keep that one.
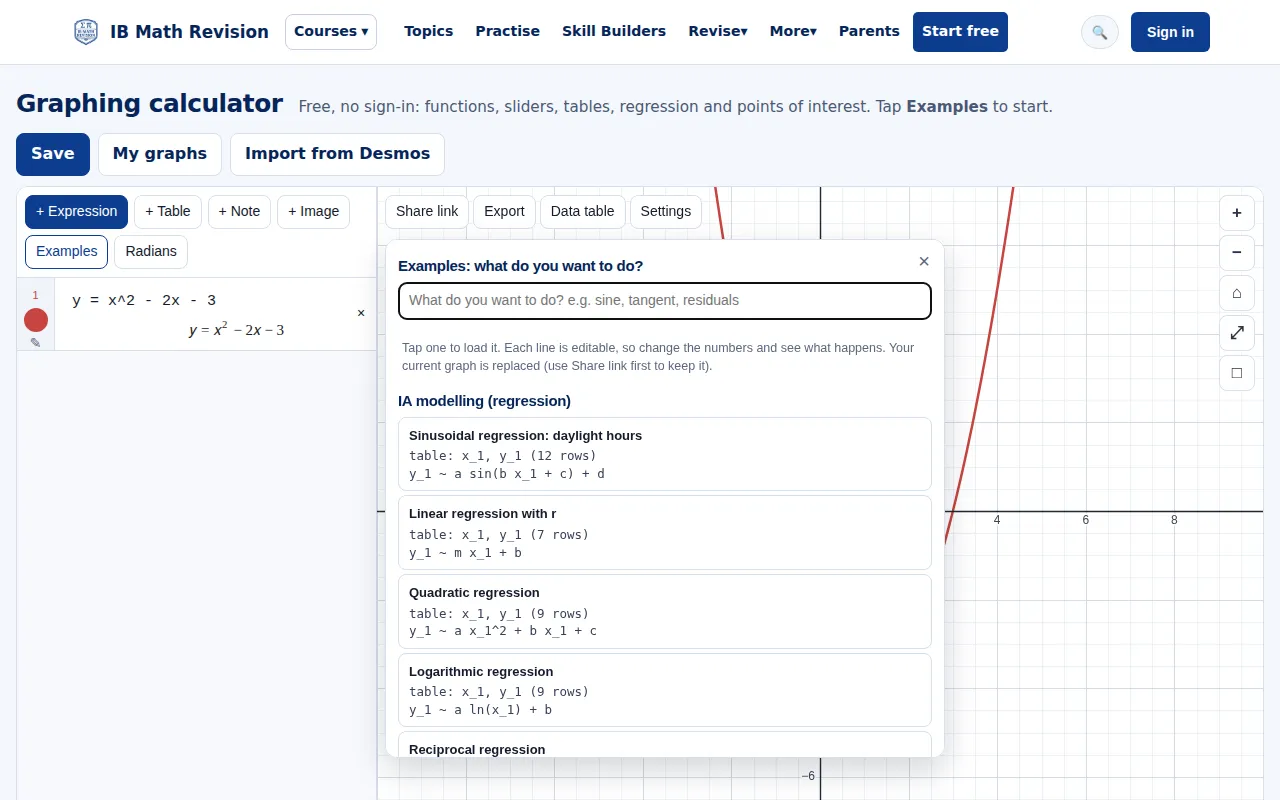
Step 2: Examples panel listing IA modelling regressions such as sinusoidal and linear regression. Full size -
Fit a model to your data
Put your data in a table and type a line with
~, for exampley_1 ~ m x_1 + b. The Grapher finds the parameters and shows R² and r, with a residual plot. Fit a model… and Compare models under the table try others.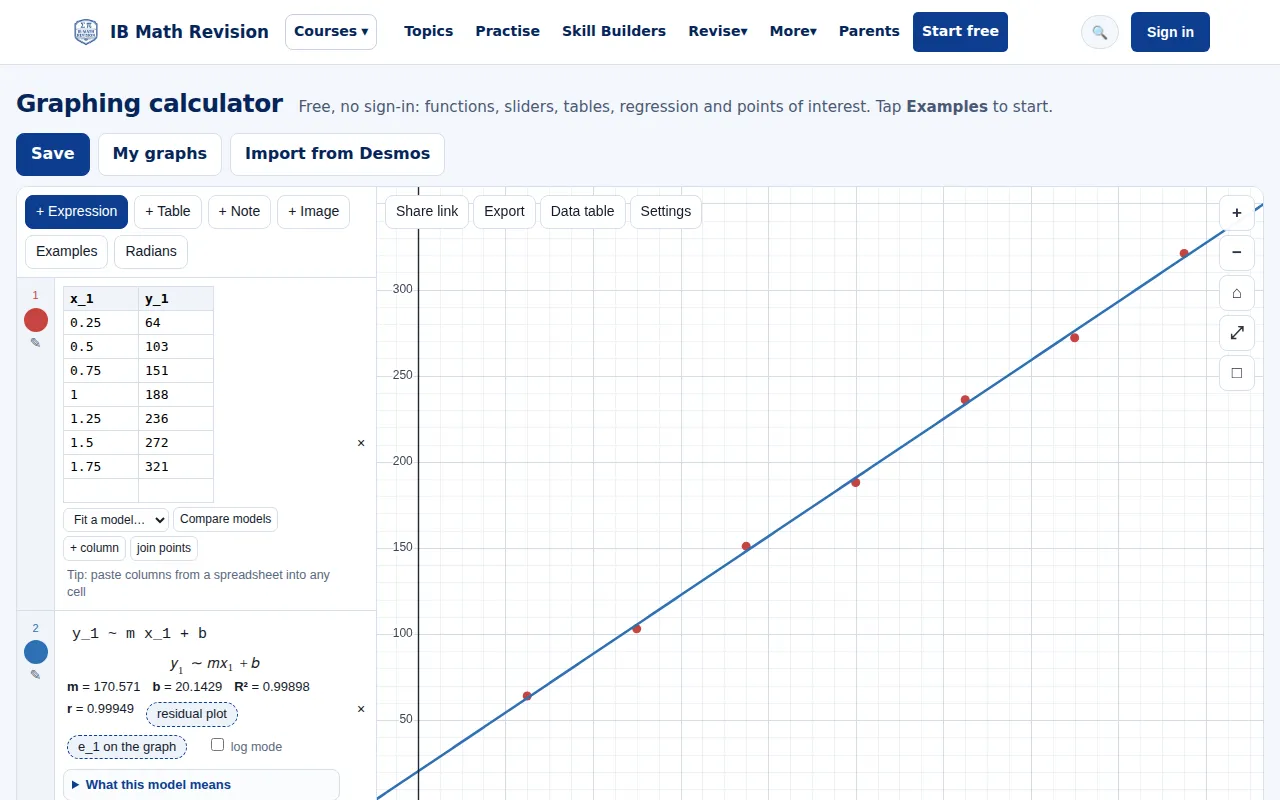
Step 3: A straight-line regression fitted to a table of data with the parameters, R squared and r shown. Full size -
Bring in a graph from Desmos
Started in Desmos? Press Import from Desmos, paste the expressions or table cells you copied there and press Bring it in. It tells you anything it could not bring in.
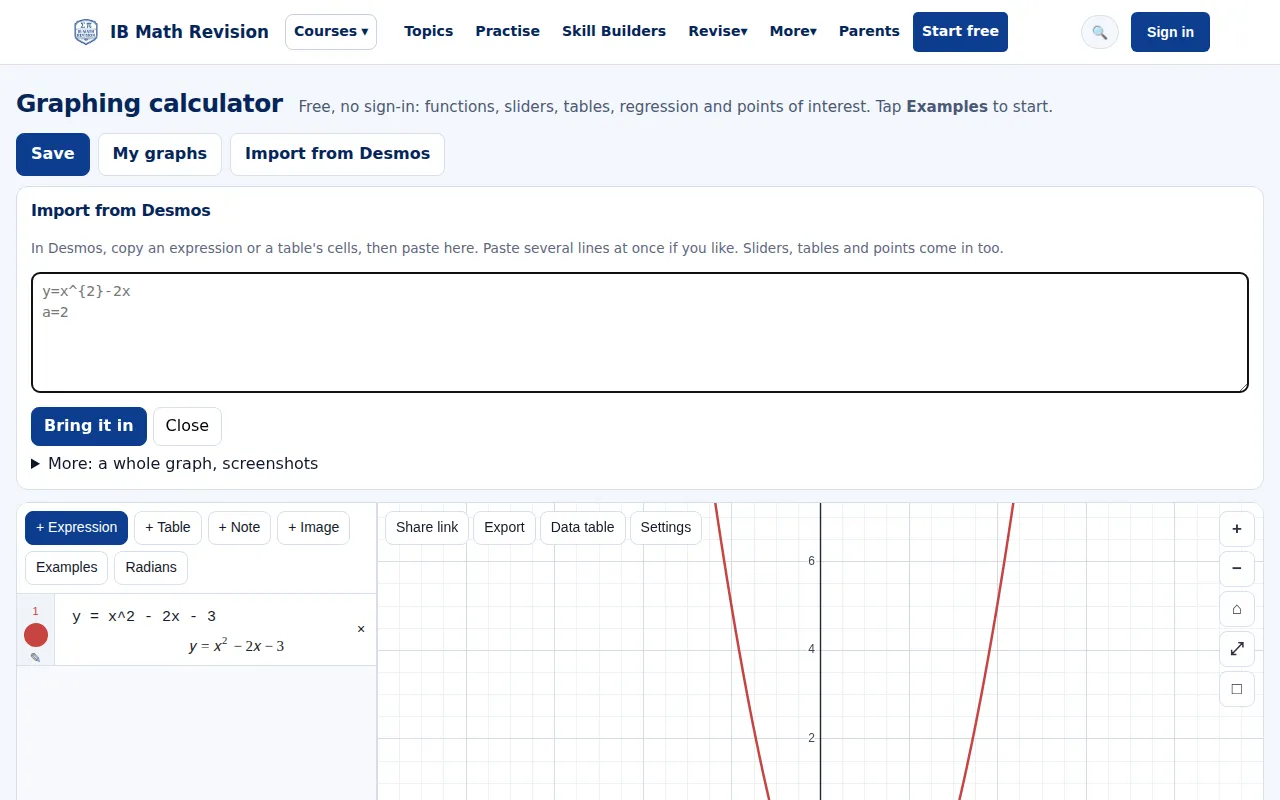
Step 4: Import from Desmos panel with pasted expressions and the Bring it in button. Full size -
Export or share your graph
Export downloads a PNG for slides or an SVG for documents, or gives you code to embed the graph on a website. Share link gives a link to this graph; signed in, Save keeps it under My graphs.
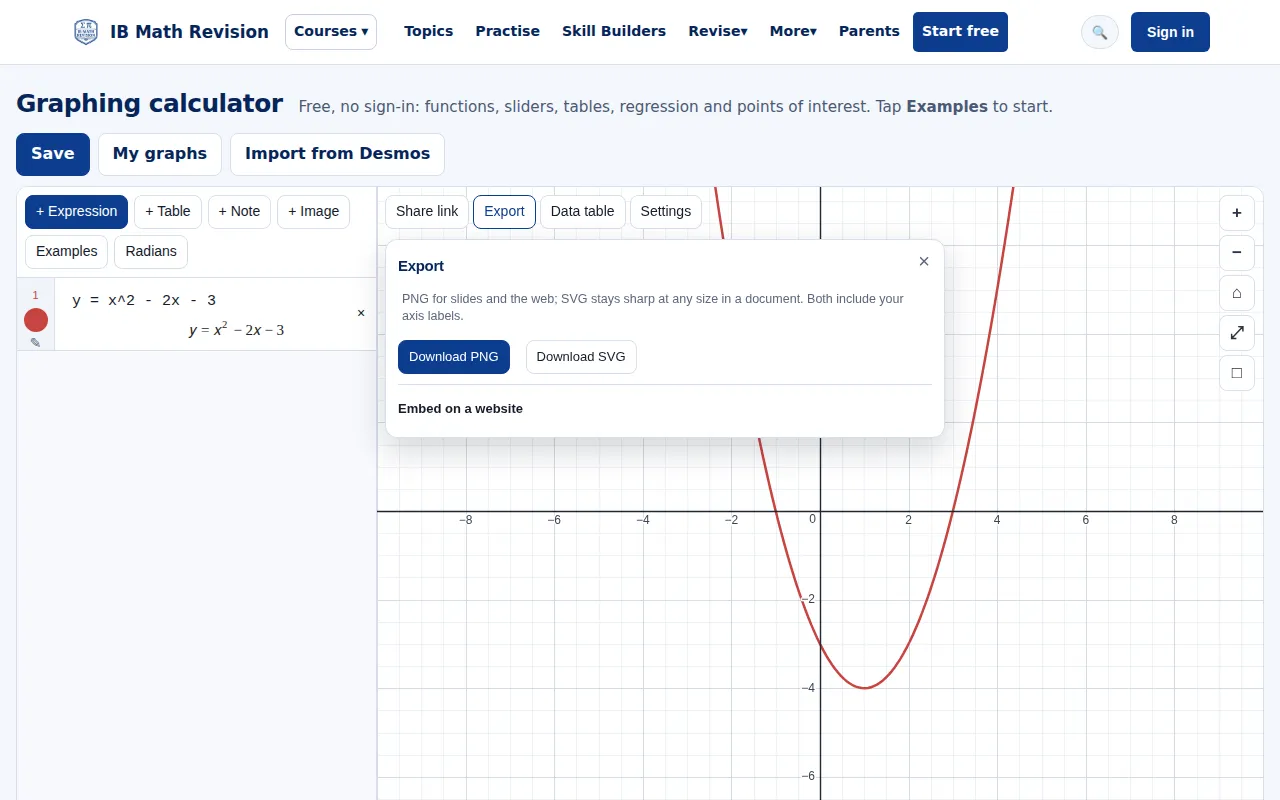
Step 5: Export panel with Download PNG, Download SVG and embed on a website. Full size
Good to know
- Step-by-step regression guides are on the regression calculator page, and graphs of common functions on graphs of functions.