Regression calculator with R², r and residuals
Paste two columns of data, type the model you want with a ~, and the Grapher finds the parameters by least squares. For a straight line you get r and R², the residuals and a plain-English explanation of what the numbers mean.
How to do it
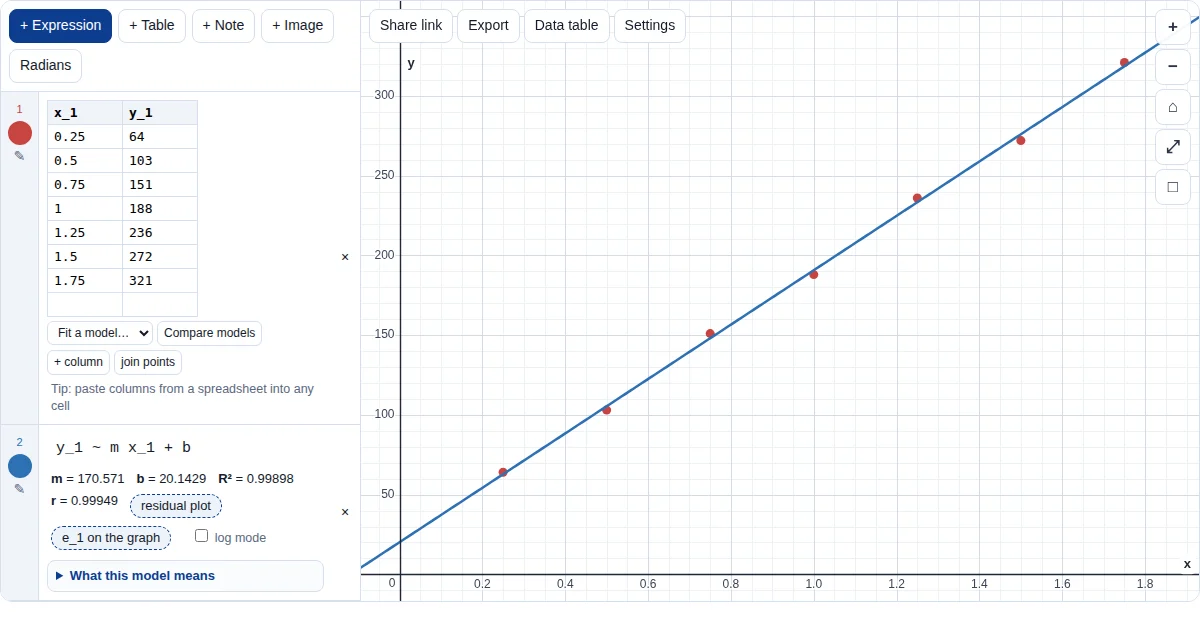
- Put your data in a table. Copy two columns from a spreadsheet and paste them into an empty line: they become a table with lists x₁ and y₁. Or press + Table and type the values. Column headings like “Time (s)” become the axis labels.
- Type the model with ~. On a new line type
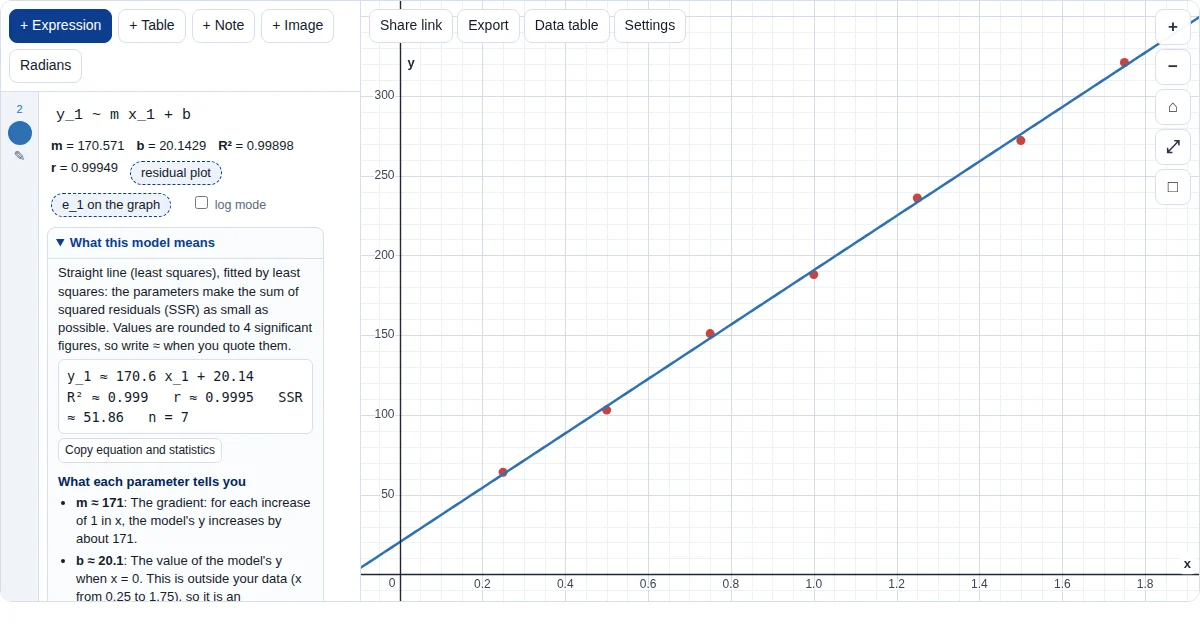
y_1 ~ m x_1 + b. The ~ means “fit this”: the Grapher chooses m and b to make the sum of squared residuals as small as possible, and draws the line. - Read m, b, r and R². The parameters appear under the line, with r (for a straight line) and R². Open What this model means for each parameter in context, how to read r and R², and whether the residuals show a pattern.
- Check the residuals. Tap residual plot under the fit for a small graph of the residuals against x, or type
(x_1, e_1)to plot them on the main graph. A random scatter about zero supports the model; a curve or a trend means it is missing something.
Good to know
- Any model works, not just a line:
y_1 ~ a x_1^2 + b x_1 + c,y_1 ~ a e^(k x_1),y_1 ~ a sin(b x_1 + c) + d… - R² on its own does not prove a model is right: look at the residuals and at whether the model makes sense in context.
- For a straight line, R² = r².
Frequently asked questions
How do I find the line of best fit and r?
Put the data in a table (lists x₁ and y₁), then type y_1 ~ m x_1 + b. The Grapher shows m, b, the correlation coefficient r and R², and draws the line.
What is the difference between r and R²?
r (Pearson's correlation coefficient) measures how close the points are to a straight line, from −1 to 1, and is shown for straight-line fits. R² (the coefficient of determination) is the fraction of the variation in y that the model explains; it is shown for every model. For a straight line, R² = r².
Does it show the residuals?
Yes. Each fit makes a residual list (e₁ for the first fit). Tap “residual plot” under the fit for a small graph of the residuals, or type (x_1, e_1) to plot them.
Is it free, and do I need an account?
It is free and needs no sign-in. A free account only adds saving to My graphs, so you can open your graphs on any device.
Learn more
- Straight-line model, worked
- IA modelling, step by step
- Correlation and regression (AI SL notes)
- Linear regression and residuals (AI HL notes)
- Regression on your GDC
More Grapher guides
The Grapher is our own free tool (graph.mathrevision.co.uk), built for IB, A Level and IGCSE students. It is not an exam calculator: practise on your own GDC for calculator papers.