Exponential regression calculator
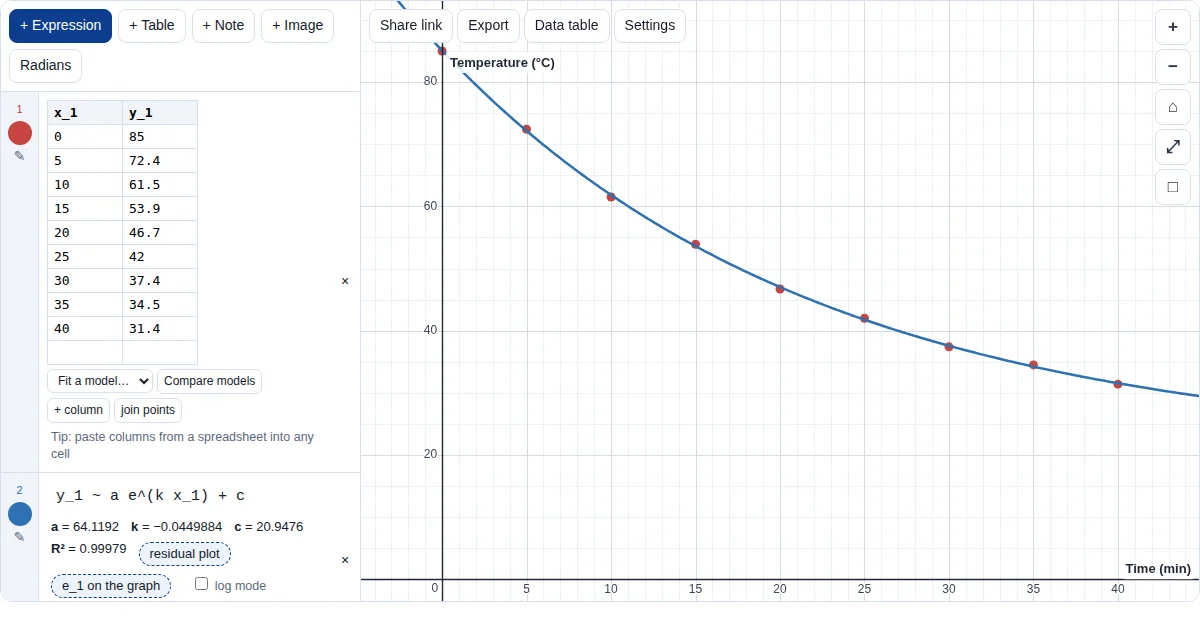
Fit an exponential model to growth or decay data. Unlike a calculator's built-in exponential regression, you can include a horizontal asymptote c, which most cooling and decay data need.
How to do it
- Enter your data. Paste or type the data as a table: x₁ for the input (time, for example) and y₁ for the quantity that grows or decays.
- Type the exponential model. Type
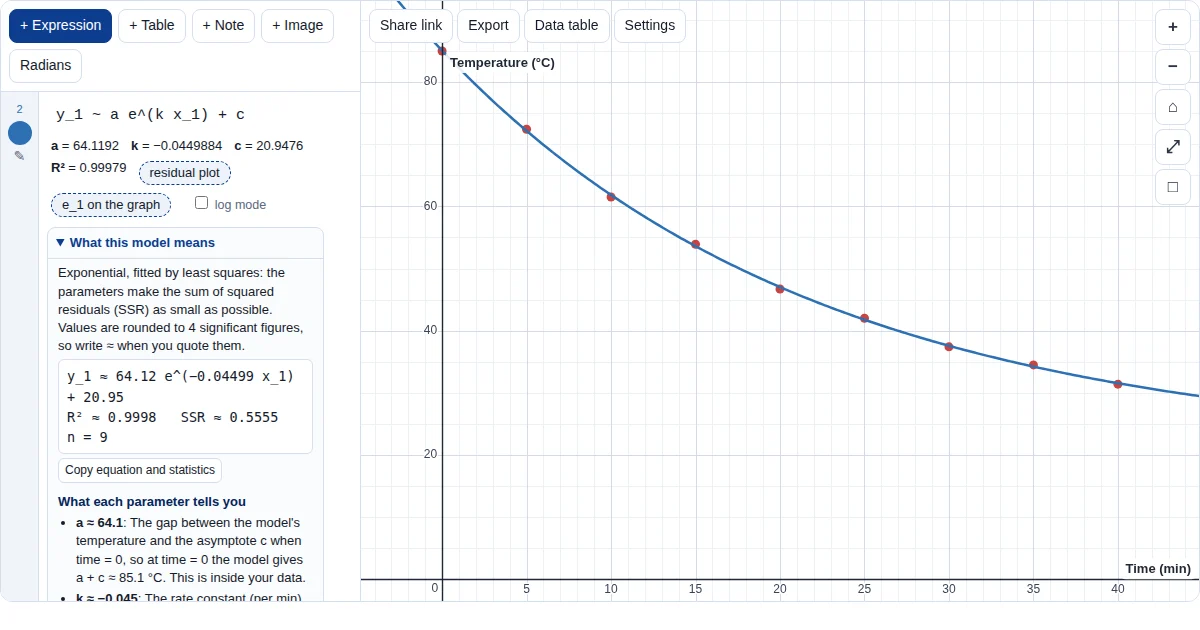
y_1 ~ a e^(k x_1)for growth or decay towards 0, ory_1 ~ a e^(k x_1) + cwhen the values level off at some other value (a cooling drink levels off at room temperature).y_1 ~ a b^(x_1)works too. - Read the parameters. k > 0 means growth and k < 0 decay; c is the level the curve approaches. What this model means puts each parameter in context, using your axis labels.
- Match your GDC if you need to. A GDC fits an exponential by fitting a straight line to ln y. Turn on log mode under the fit to get the same answer; without it the Grapher fits the curve to the data directly.
Good to know
- Without the + c, an exponential decays towards 0. If your data level off somewhere else, the model needs c.
- Log mode and direct fitting give slightly different parameters: log mode minimises the squared errors in ln y, direct fitting the squared errors in y. Say which you used.
- On a log y-axis (Settings) data that follow y = ae^(kx) lie on a straight line.
Frequently asked questions
How do I do exponential regression with an asymptote?
Type y_1 ~ a e^(k x_1) + c. The Grapher fits a, k and c together; c is the value the curve approaches.
Why is my answer different from my calculator's ExpReg?
A GDC's exponential regression fits a straight line to ln y against x. The Grapher fits the curve to the data directly unless you turn on log mode under the fit, which gives the GDC's answer.
Can it fit y = ab^x?
Yes: type y_1 ~ a b^(x_1). It is the same family as y = ae^(kx), with b = e^k.
Does it give R²?
Yes, with the residuals and a residual plot.
Learn more
- Exponential model, worked
- Exponential models (AI SL notes)
- Exponential and log functions (AA SL notes)
- Regression on your GDC
- IA modelling, step by step
More Grapher guides
The Grapher is our own free tool (graph.mathrevision.co.uk), built for IB, A Level and IGCSE students. It is not an exam calculator: practise on your own GDC for calculator papers.