Curve fitting calculator: fit any model to your data
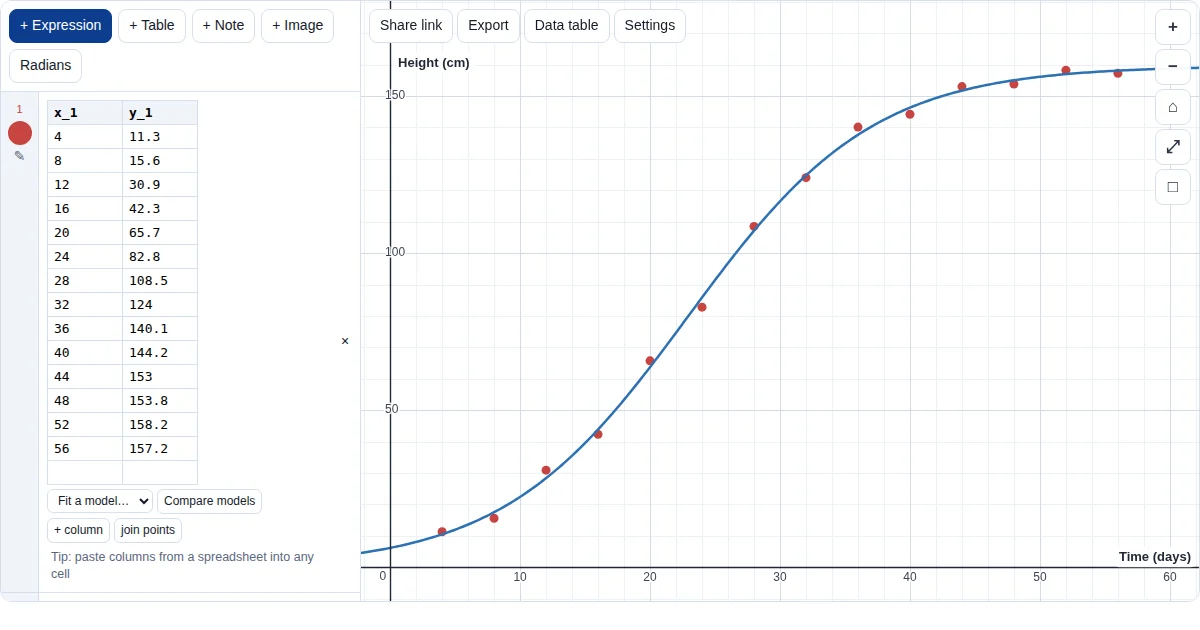
Type any formula with a ~ and the Grapher fits it to your data: polynomials, exponentials, sine curves, logistic curves or your own formula. Compare models fits the standard models to the same data and ranks them, so you can choose with evidence.
How to do it
- Enter or paste your data. Paste two columns into an empty line, or press + Table. Give the axes labels with units in Settings: the explanations under each fit use them.
- Type the formula you want to fit. For example
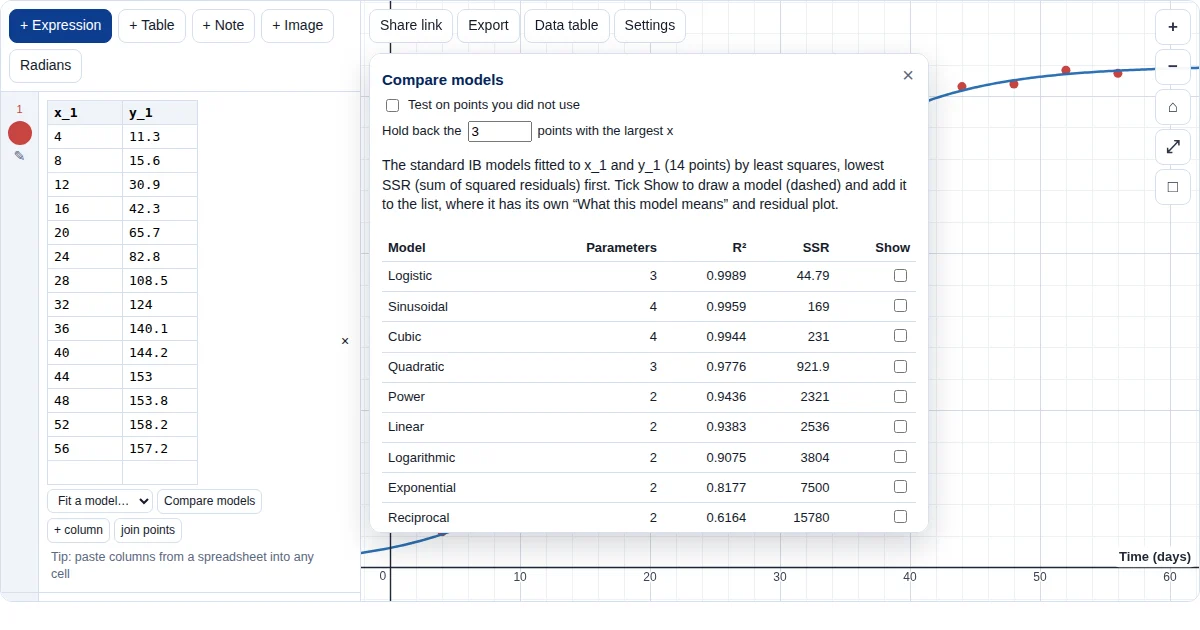
y_1 ~ L/(1 + C e^(-k x_1)). Any letter that is not defined becomes a parameter. Models that are linear in their parameters are solved exactly; for the others the Grapher searches for a good start itself, so you never type starting values. - Compare the standard models. Press Compare models under the table. It fits nine standard models (linear, quadratic, cubic, exponential, logarithmic, power, sinusoidal, logistic and reciprocal) and lists them by the sum of squared residuals, with notes on the number of parameters. Show adds one to the graph.
- Test on points you did not use. Turn on “Test on points you did not use”: each model is fitted without the last few points and ranked by how well it predicts them. A model that fits well but predicts badly is over-fitting.
Good to know
- Choose a model using the context and the residuals, not only the fit statistics: a cubic can fit growth data well and still make no sense beyond it.
- A parameter you define on another line (for example
b = 2pi/12) is held fixed in the fit. - If a fit does not converge, the Grapher says so and suggests what to try.
Frequently asked questions
Do I need to give starting values for a non-linear fit?
No. Models that are linear in their parameters are solved exactly by least squares. For non-linear models the Grapher first runs a grid search for a good starting point and then refines it with the Levenberg–Marquardt method.
Which models can Compare models fit?
Nine standard models: linear, quadratic, cubic, exponential, logarithmic, power, sinusoidal, logistic and reciprocal. You can also type any other formula with ~ yourself.
What does testing on points you did not use do?
It holds back the points with the largest x (about a fifth of them by default), fits each model to the rest and ranks the models by how well they predict the held-back points. It is a check for over-fitting.
Can I use it for my IA?
Yes. The explanations under each fit explain and prompt; they never write your conclusions. Say in your IA which software you used and explain what it did, as you would for any technology.
Learn more
- Choosing and comparing models
- Logistic model, worked
- The logistic curve and its features
- Model my data (IA helper)
- IA modelling, step by step
- Modelling with functions (AI HL notes)
- Using technology in your Maths IA
More Grapher guides
The Grapher is our own free tool (graph.mathrevision.co.uk), built for IB, A Level and IGCSE students. It is not an exam calculator: practise on your own GDC for calculator papers.