A free Desmos alternative for maths modelling, compared honestly
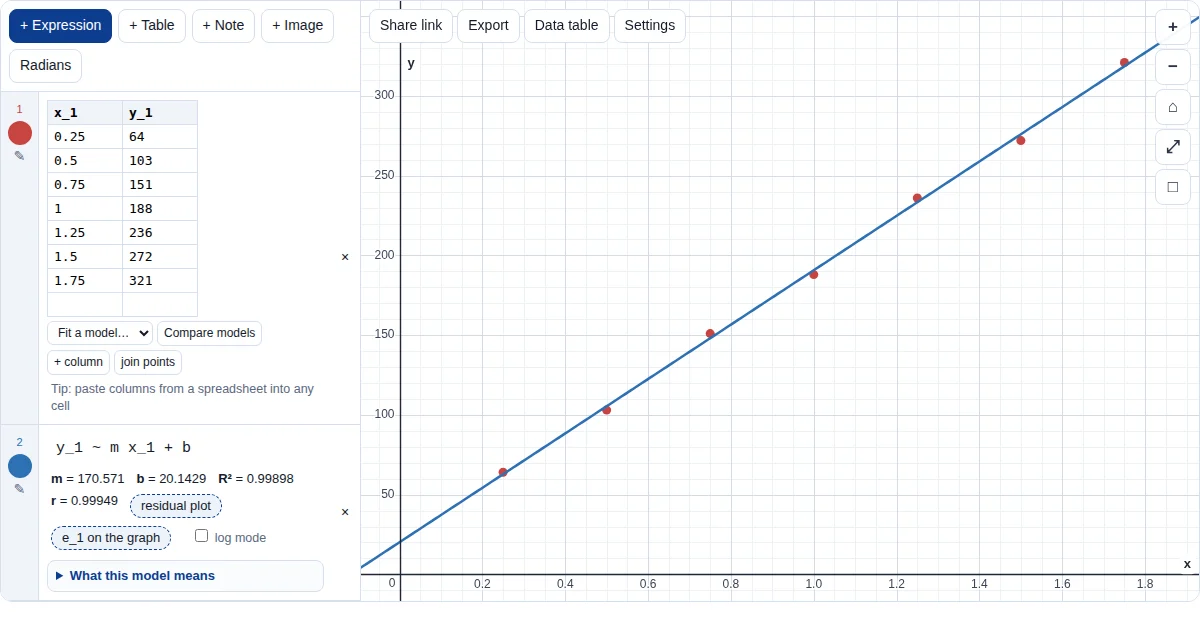
Desmos is an excellent free graphing calculator, and many students already use it. Our free Grapher types the same way for most things, including ~ regression, and is built around modelling data for coursework such as the IB Maths IA. Here is a fair comparison, so you can choose.
The short answer
For plotting functions, sliders and fitting a regression, both are free and both work well. Desmos has more features overall (3D, geometry, audio trace) and a long track record.
Our Grapher's difference is what happens after the fit: it explains each parameter in your context, checks the residuals for a pattern, compares the standard models on your data and can test them on points you did not use. It explains and asks questions; it never writes your conclusions.
What both do
| Feature | Our Grapher | Desmos graphing calculator |
|---|---|---|
| Price | Free, no sign-in (a free account adds saving) | Free, online [1] |
| Functions, points and sliders | Yes, with animated sliders | Yes, with sliders and animation [1] |
| Regression with ~ | Any formula; r for lines, R² for every model | Yes; r for linear regressions, R² for nonlinear ones [2] |
| Residuals | Residual list e₁, residual plot under the fit, pattern check | Yes, residuals of a regression [2] |
| Log mode (fit the logarithms, like a GDC) | Yes | Yes [3] |
| Logarithmic axes | Yes, with “Linearise it” for a fitted model | Yes [4] |
What our Grapher adds for modelling and the IA
- What this model means. Under every fit, plain text explains each parameter using your axis labels and units, how to read R² and r, where the model can be trusted, and questions to ask yourself. It explains; the write-up stays yours. See it on a regression.
- A residual pattern check. A quick check for a curve or a trend in the residuals and for long runs of the same sign, with what a pattern suggests about the model. Residual plots.
- Compare models. Fits nine standard models to the same data and ranks them by the sum of squared residuals, with notes on the number of parameters. Curve fitting.
- Test on points you did not use. Holds back the last few points, fits each model to the rest and ranks the models by how well they predict the held-back points: a check for over-fitting.
- Linearise it. One tap switches on the log axes that make the fitted model a straight line (log–log for a power law, log y for an exponential). Log–log plots.
- Accuracy and evaluation prompts. What rounding the parameters does to R², the data's precision, and prompts for evaluating the model, matching our free IA modelling guides.
- No starting values for non-linear fits. The Grapher finds a starting point itself before refining a non-linear fit, so logistic and sine models fit without guessing.
What Desmos does that we don't
- Desmos also makes a 3D calculator and a geometry tool; our Grapher is 2D only. [6][7]
- Desmos has accessibility features we don't have, such as audio trace (hearing a graph) and support for refreshable Braille displays, and says its tools meet the Web Content Accessibility Guidelines 2.2. Ours offers a data table of values and points for screen readers. [5]
Which should you use?
Use whichever you are fastest with: the typing is the same for most things, so you can switch. If you are fitting a model to data for an IA, a lab report or a project, try ours for the explanations and the model comparison.
Neither is an exam calculator for IB, A Level or IGCSE papers: practise calculator questions on your own GDC (see our calculator skills guides).
Frequently asked questions
Is the Grapher really free?
Yes. Everything on /graph is free and needs no sign-in. A free account only adds saving to My graphs (up to 200 graphs), so you can open them on any device.
Is the typing the same as in Desmos?
For most things, yes: y = x^2, sliders from undefined letters, lists like x_1, and y_1 ~ m x_1 + b for regression follow the conventions students already know. The Grapher is our own code and is not affiliated with Desmos.
Can I use it in my IA?
Yes. Say which software you used and explain what it did, as you would for any technology. The explanations under each fit help you understand the model; the analysis and conclusions in your IA must be your own.
Can I put a graph on my own website?
Yes. Export has “Embed on a website”, which gives you code for an interactive copy of your graph with a link back to the Grapher.
Grapher guides
Sources
- Getting Started: Desmos Graphing Calculator (Desmos Help Center) : Desmos describes a free online graphing calculator for functions, points, sliders and animation. Checked 4 October 2026.
- Regressions (Desmos Help Center) : Regression statistics: r for linear regressions, R² for nonlinear regressions, and residuals. Checked 4 October 2026.
- Log Mode (Desmos Help Center) : In log mode r and r² are calculated from the transformed data and the residuals from the untransformed data. Checked 4 October 2026.
- Set an Axis to a Logarithmic Scale (Desmos Help Center) : How to set a graph axis to a logarithmic scale. Checked 4 October 2026.
- Accessibility (Desmos) : Audio trace, screen reader and refreshable Braille display support, keyboard shortcuts, and WCAG 2.2. Checked 4 October 2026.
- Desmos 3D Calculator API documentation : The Desmos 3D Graphing Calculator. Checked 4 October 2026.
- Desmos Geometry API documentation : The Desmos Geometry tool. Checked 4 October 2026.
Desmos is a trademark of its owner, named here only to identify the product. IB Math Revision is not affiliated with or endorsed by Desmos.