Residual plot calculator: check your model's fit
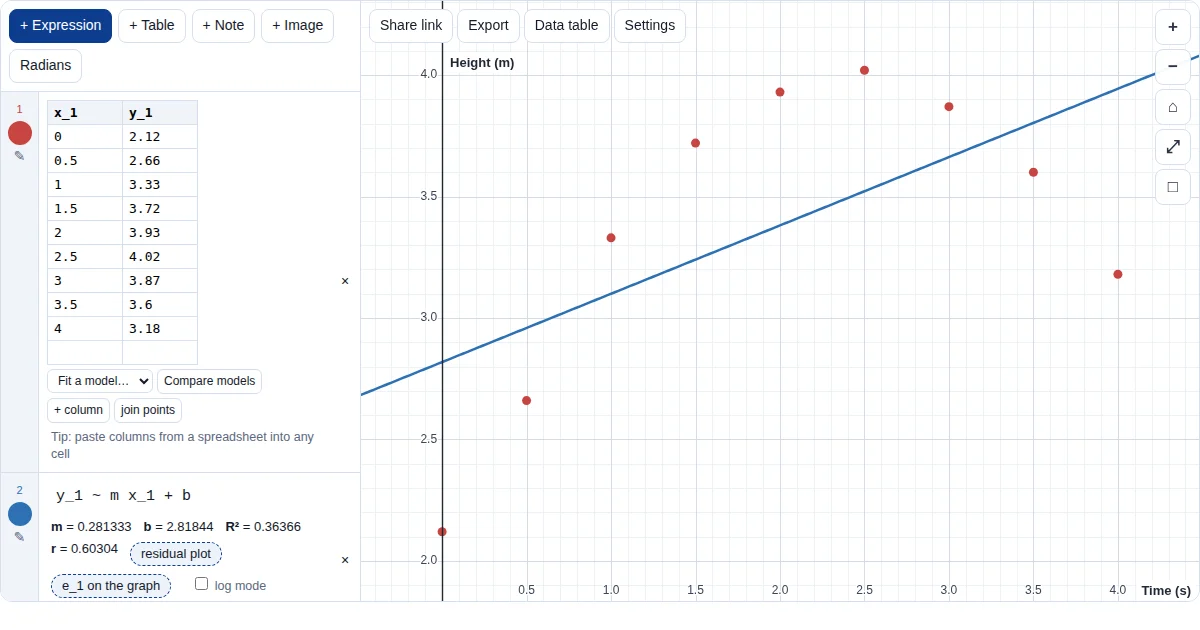
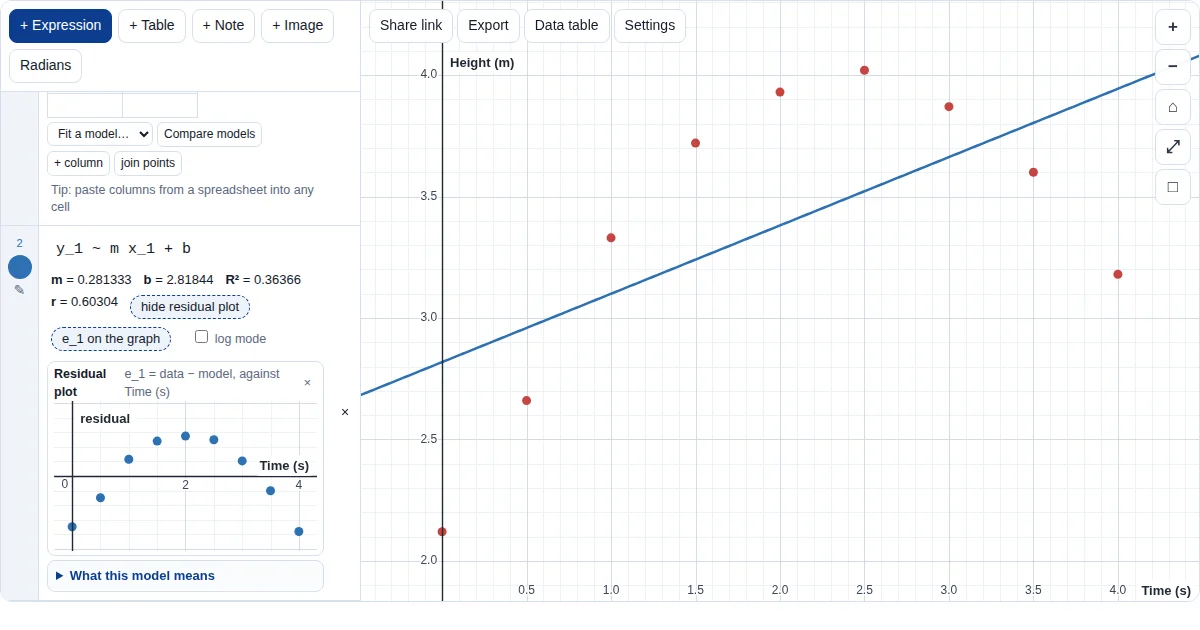
A residual is data minus model. If a model is right, its residuals scatter randomly about zero; a curve in the residuals means the model has the wrong shape. Here a straight line is fitted to curved data, and the residual plot shows it.
How to do it
- Fit a model. Enter the data as a table and type a model with ~, for example
y_1 ~ m x_1 + b. - Open the residual plot. Tap residual plot under the fit: a small graph of the residuals against x appears under the line. Or type
(x_1, e_1)to plot them on the main graph. - Look for a pattern. What this model means runs a quick check for a curve or a trend in the residuals and for long runs of the same sign, and says what a pattern suggests. Here the ∩ shape says a quadratic would fit better.
- Try a better model. Type
y_1 ~ a x_1^2 + b x_1 + con a new line and compare the two residual plots and sums of squared residuals.
Good to know
- Export can include the residual plots below the graph, as a PNG or an SVG for your write-up.
- With fewer than six points the residual check says the pattern is hard to judge: it is a quick check, not a formal test.
Frequently asked questions
What should a good residual plot look like?
Points scattered randomly above and below zero with no curve, no trend and no fan shape. A pattern means the model is missing something about the data.
How do I plot residuals?
Tap “residual plot” under any fit, or type (x_1, e_1) on a new line: e₁ is the residual list of the first fit.
Can I put the residual plot in my IA?
Yes. Export downloads the graph as a PNG or SVG and can include each open residual plot below it. Label it and explain what it shows in your own words.
Learn more
- Linear regression and residuals (AI HL notes)
- Choosing and comparing models
- Quadratic model, worked
- Straight-line model, worked
- Using technology in your Maths IA
More Grapher guides
The Grapher is our own free tool (graph.mathrevision.co.uk), built for IB, A Level and IGCSE students. It is not an exam calculator: practise on your own GDC for calculator papers.