Logarithmic regression calculator
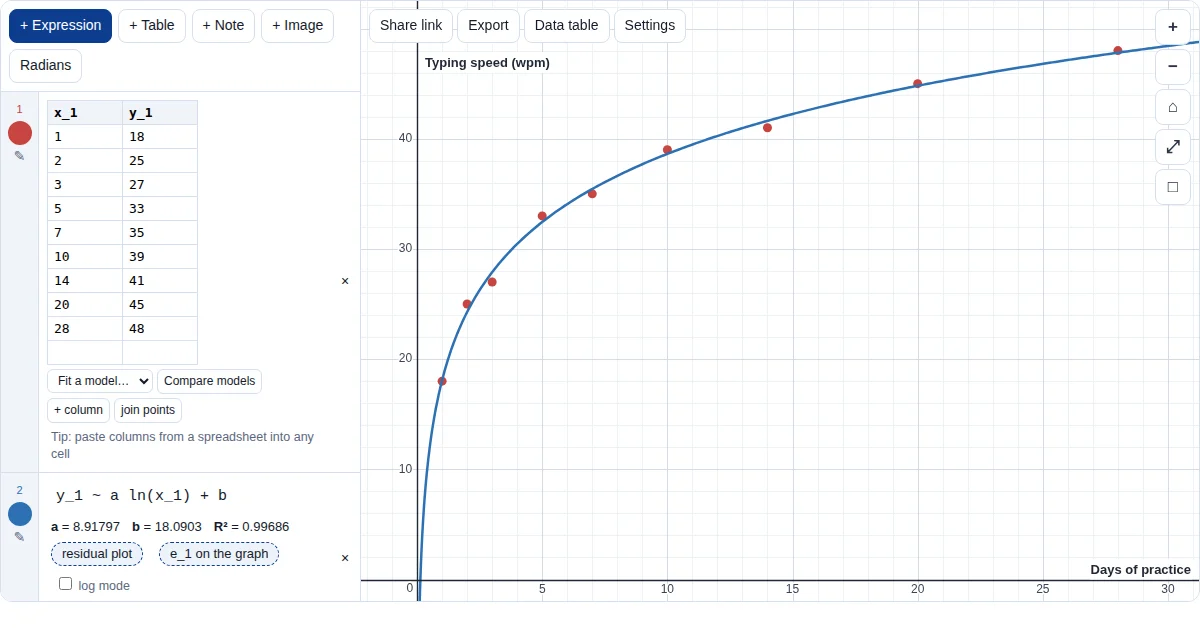
A logarithmic model rises quickly at first and then more and more slowly, without levelling off. Fit it with one line, and check it on a log x-axis.
How to do it
- Enter your data. Paste or type the table. Every x must be positive, because ln x is only defined for x > 0.
- Type the model. Type
y_1 ~ a ln(x_1) + b. The model is linear in a and b, so the fit is exact least squares, the same as a GDC's LnReg. - Interpret a and b. b is the value of y when x = 1 (ln 1 = 0), and a is the increase in y each time x is multiplied by e (about 2.72). What this model means words this for your axis labels.
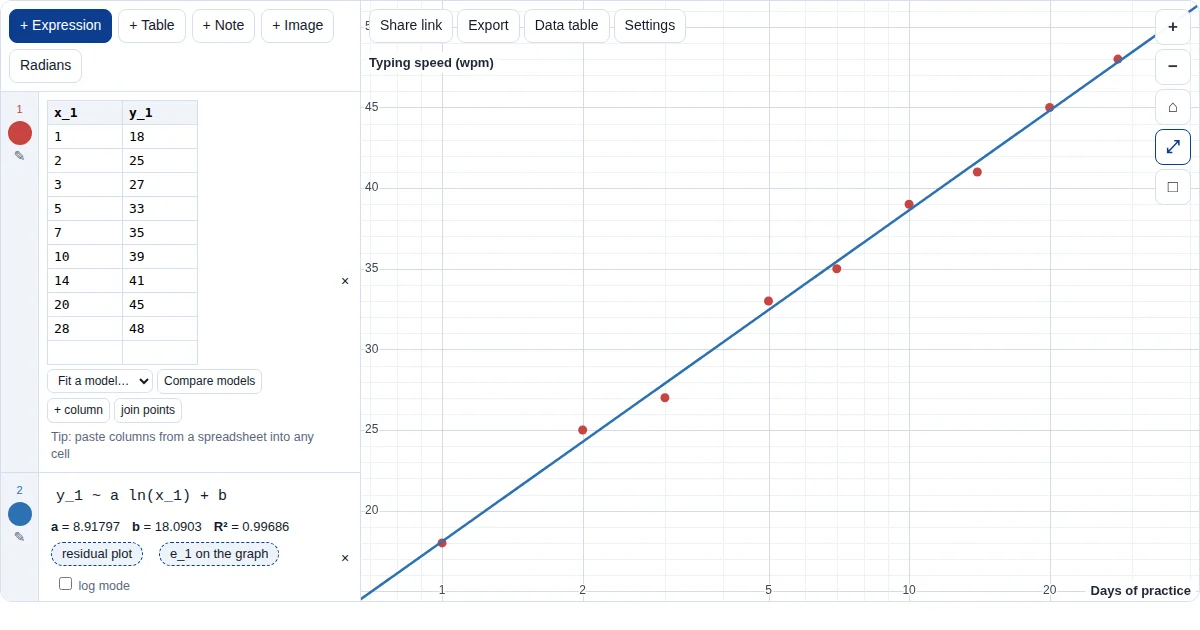
- Check on a log x-axis. In Settings, turn on the log scale for x (or use Linearise it in the model's panel). If the model fits, the points lie close to a straight line.
Good to know
- A logarithmic model has no upper limit; if your data level off, try a logistic or an exponential with an asymptote instead.
- Use
log(x_1)for base 10: it changes a, not the quality of the fit.
Frequently asked questions
Is this the same as my GDC's LnReg?
Yes. y = a ln x + b is linear in a and b, so the Grapher and a GDC both solve it exactly by least squares and give the same a, b and R².
What if some of my x values are 0 or negative?
ln x is only defined for x > 0, so a logarithmic model cannot use those points. If zero means something in your context, think about measuring x differently (for example counting days from 1), and say so in your write-up.
How do I know a log model is right?
Look at the residual plot and at the data on a log x-axis: a log model gives a straight line there and residuals with no pattern. Then ask whether a model that never levels off makes sense in your context.
Learn more
- Logarithmic model, worked
- Exponent and logarithm laws (AA SL notes)
- Exponential and log functions (AA SL notes)
- Choosing and comparing models
- IA modelling, step by step
More Grapher guides
The Grapher is our own free tool (graph.mathrevision.co.uk), built for IB, A Level and IGCSE students. It is not an exam calculator: practise on your own GDC for calculator papers.