IA statistics, step by step · t-test
The t-test for an IA: two-sample (pooled) and paired
Do gamers react faster? Did a skipping programme lower resting heart rate? The first needs a two-sample t-test, the second a paired one. Both are worked here, with their assumptions checked and an honest note on Welch's test.
Example data, invented for this guide. The context is realistic, but the numbers were made up to show the method. Use your own collected or sourced data in your IA.
When to use it
- One numerical variable compared between two groups (two-sample), or measured twice on the same individuals (paired).
- Each group's data roughly normal, without strong skew or outliers.
- For the pooled test: similar spreads in the two groups.
Course fit: AI SL and HL: the two-sample t-test with a pooled variance (assuming normal populations with equal variances), one- and two-tailed, is in the AI SL core. A paired t-test is a t-test for one mean (the mean difference), which belongs with the AI HL tests for a population mean. Welch's unequal-variance test is beyond the syllabus.
New course (first assessment May 2029): the IB has confirmed that the hypothesis test for the population mean of a normal distribution (which includes the paired t-test as taught in AI HL) is not on the AI HL syllabus from 2029 (AI curriculum updates). You can still use it in an IA if you explain it clearly.
The example data
26 students took the same online reaction-time test (mean of five clicks). 12 play action video games for at least 5 hours a week (gamers); 14 do not.
| Gamers (ms) | Non-gamers (ms) | |
|---|---|---|
| 1 | 231 | 262 |
| 2 | 245 | 248 |
| 3 | 218 | 255 |
| 4 | 252 | 271 |
| 5 | 240 | 240 |
| 6 | 226 | 259 |
| 7 | 236 | 266 |
| 8 | 249 | 251 |
| 9 | 222 | 244 |
| 10 | 238 | 270 |
| 11 | 244 | 258 |
| 12 | 230 | 249 |
| 13 | 263 | |
| 14 | 253 |
Two-sample t-test: gamers and non-gamers
The groups are different students, so the samples are independent. The question is one-sided: do gamers have a lower mean reaction time?
Step 1 · Hypotheses
H0: μ1 = μ2; H1: μ1 < μ2, where μ1 is the population mean for Gamers and μ2 for Non-gamers. Significance level 5%.
The pooled two-sample t-test assumes both populations are normally distributed with equal variances, and that the two samples are independent random samples. Check these (Step 2) and say how far they hold.
Step 2 · Summary of each sample
| n | Mean x̄ | sn−1 | s²n−1 | |
|---|---|---|---|---|
| Gamers | 12 | 235.92 | 10.75 | 115.5 |
| Non-gamers | 14 | 256.36 | 9.467 | 89.63 |
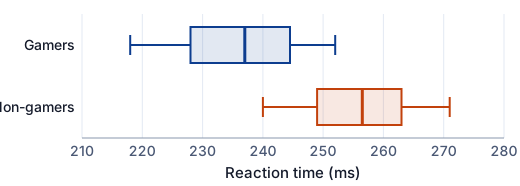
Ratio of the larger to the smaller variance: 1.29. Close enough to 1 for the equal-variance assumption to be reasonable (a common rule of thumb is a ratio below 2).
In the full worked analysis
- The rest of the working: steps 3 to 5
- Paired t-test: before and after
- What the example shows, in context
- On a GDC: TI-84 Plus CE, TI-Nspire CX and Casio fx-CG50
- What examiners look for
- Common mistakes
- Limitations to discuss
How this maps to the IA criteria
- A Criterion A (Presentation): Hypotheses, assumption checks, calculation and conclusion in that order, with the box plots alongside.
- B Criterion B (Mathematical communication): μ₁, μ₂, s, t, ν and p defined and used correctly.
- C Criterion C (Personal engagement): A question you can test fairly, and a design (paired or independent) you chose and can defend.
- D Criterion D (Reflection): Honest discussion of the assumptions, the design and causation.
- E Criterion E (Use of mathematics): The right test, correctly carried out and interpreted for your course.
These are the current criteria A–E, for exams up to November 2028. For the new courses (first assessment May 2029) the IB has confirmed one set of four criteria for SL and HL: A Problem specification (4 marks), B Abstraction (6), C Computation (4) and D Interpretation (6), still 20 marks and 20% of the grade at both levels — see the IB's new AA and AI subject briefs. The detailed descriptors come with the new guide; check with your teacher which criteria apply to you. The advice is our summary, not the IB's wording.
Frequently asked questions
Is the t-test in the IB Maths syllabus?
The two-sample t-test with a pooled variance is in AI SL (and so AI HL). It is not in the AA courses, though AA students may use it if they explain it.
Should I use a pooled or unpooled t-test?
The IB AI course uses the pooled test, which assumes equal population variances. If your sample variances are very different, say so; Welch's unpooled test is beyond the syllabus but allowed if you explain it.
When do I use a paired t-test?
When each value in one sample is linked to one in the other — the same person before and after, or matched pairs. Test the mean of the differences.
Next steps
- Criterion E: use of mathematicsWhat “commensurate with the level of the course” means for statistics, at SL and HL.
- Criterion D: reflectionSample, bias, assumptions and causation: where statistics IAs gain or lose marks.
- Plan your statistics IAThe section-by-section framework for a statistics exploration, with your own notes.
- Get feedback on your write-upCriterion-by-criterion feedback on your draft, with evidence from your own text.
- Exemplar: Sleep and reactions (statistics)AI SL · a statistics exploration that uses this technique, marked criterion by criterion.
- Exemplar: Mid-band draft (statistics)AI SL · a statistics exploration that uses this technique, marked criterion by criterion.
Related: Descriptive statistics and box plots · Is my data normal?. Or analyse your own data, find a data set in the IA data bank, and see what the IA package adds.
Free: the IA checklist an examiner uses
Every check for Criteria A–E in a 4-page PDF, the mistakes that cost the most marks and a self-assessment grid. We'll email it with a short IA tip every few days, timed to your deadline if you give it. Free — no account, no payment.
While you wait for the email: read the full statistics workflow →