IA statistics, step by step · Spearman's rank
Spearman's rank correlation coefficient, step by step
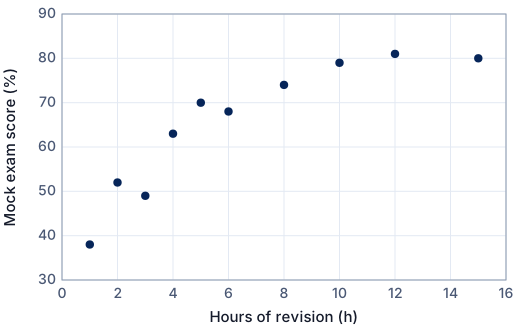
When the relationship is consistent but curved, or the data are only an order, Spearman's rank does what Pearson's r cannot. Here it is worked from the ranks, side by side with Pearson's r on the same data.
Example data, invented for this guide. The context is realistic, but the numbers were made up to show the method. Use your own collected or sourced data in your IA.
When to use it
- The scatter graph shows a consistent rise or fall that is not a straight line.
- One or both variables are rankings (league positions, judges' scores).
- There are outliers you want a statistic to resist.
Course fit: AI SL and HL: Spearman's rank correlation coefficient rₛ, and when to use it rather than Pearson's r, are in the AI SL core. It is not in the AA courses — AA students can use it if they explain it.
The example data
Ten students reported how many hours they revised in the week before a mock exam, and their score.
| i | x: Hours of revision (h) | y: Mock exam score (%) |
|---|---|---|
| 1 | 1 | 38 |
| 2 | 2 | 52 |
| 3 | 3 | 49 |
| 4 | 4 | 63 |
| 5 | 5 | 70 |
| 6 | 6 | 68 |
| 7 | 8 | 74 |
| 8 | 10 | 79 |
| 9 | 12 | 81 |
| 10 | 15 | 80 |
Spearman's rank from the ranks
Rank each variable, find the differences in rank, and use the formula.
Step 1 · Rank each variable separately
Give the smallest value rank 1 (or the largest — but do the same for both variables). Tied values share the mean of the ranks they would take.
| i | x | y | rank of x | rank of y | d | d² |
|---|---|---|---|---|---|---|
| 1 | 1 | 38 | 1 | 1 | 0 | 0 |
| 2 | 2 | 52 | 2 | 3 | −1 | 1 |
| 3 | 3 | 49 | 3 | 2 | 1 | 1 |
| 4 | 4 | 63 | 4 | 4 | 0 | 0 |
| 5 | 5 | 70 | 5 | 6 | −1 | 1 |
| 6 | 6 | 68 | 6 | 5 | 1 | 1 |
| 7 | 8 | 74 | 7 | 7 | 0 | 0 |
| 8 | 10 | 79 | 8 | 8 | 0 | 0 |
| 9 | 12 | 81 | 9 | 10 | −1 | 1 |
| 10 | 15 | 80 | 10 | 9 | 1 | 1 |
| Σ | 6 |
n = 10; no ties.
Step 2 · Spearman's rank correlation coefficient
rs = 1 − 6Σd² / [n(n² − 1)] = 1 − 6 × 6 / (10 × 99) = 0.9636
With no ties this equals Pearson's r calculated on the ranks — the way a GDC does it.
In the full worked analysis
- The rest of the working: steps 3 to 3
- For comparison: Pearson's r on the same data
- What the example shows, in context
- On a GDC: TI-84 Plus CE, TI-Nspire CX and Casio fx-CG50
- What examiners look for
- Common mistakes
- Limitations to discuss
How this maps to the IA criteria
- A Criterion A (Presentation): Ranking table and result together, after the scatter graph that motivates them.
- B Criterion B (Mathematical communication): rₛ, d and n defined; ties explained.
- C Criterion C (Personal engagement): Spotting that the pattern is curved and choosing the statistic that fits it.
- D Criterion D (Reflection): Comparing rₛ with r and saying what the difference shows about the relationship.
- E Criterion E (Use of mathematics): Ranks, Σd² and rₛ correct, with ties handled properly.
These are the current criteria A–E, for exams up to November 2028. For the new courses (first assessment May 2029) the IB has confirmed one set of four criteria for SL and HL: A Problem specification (4 marks), B Abstraction (6), C Computation (4) and D Interpretation (6), still 20 marks and 20% of the grade at both levels — see the IB's new AA and AI subject briefs. The detailed descriptors come with the new guide; check with your teacher which criteria apply to you. The advice is our summary, not the IB's wording.
Frequently asked questions
When should I use Spearman's rank instead of Pearson's r?
When the relationship is monotonic but not linear, when your data are ranks, or when outliers would distort r. Look at the scatter graph first.
How do I deal with ties in Spearman's rank?
Give tied values the mean of the ranks they share, then calculate Pearson's r on the ranks (the formula with Σd² is only exact without ties).
Can I test whether rₛ is significant?
Testing rₛ uses tables of critical values and goes beyond the IB syllabus. You may do it if you explain it; otherwise interpret rₛ and discuss the sample size.
Next steps
- Criterion E: use of mathematicsWhat “commensurate with the level of the course” means for statistics, at SL and HL.
- Criterion D: reflectionSample, bias, assumptions and causation: where statistics IAs gain or lose marks.
- Plan your statistics IAThe section-by-section framework for a statistics exploration, with your own notes.
- Get feedback on your write-upCriterion-by-criterion feedback on your draft, with evidence from your own text.
- Exemplar: Sleep and reactions (statistics)AI SL · a statistics exploration that uses this technique, marked criterion by criterion.
- Exemplar: Bus lateness and rain (AI SL)AI SL · a statistics exploration that uses this technique, marked criterion by criterion.
Related: Pearson's correlation and regression · Choosing the right test. Or analyse your own data, find a data set in the IA data bank, and see what the IA package adds.
Free: the IA checklist an examiner uses
Every check for Criteria A–E in a 4-page PDF, the mistakes that cost the most marks and a self-assessment grid. We'll email it with a short IA tip every few days, timed to your deadline if you give it. Free — no account, no payment.
While you wait for the email: read the full statistics workflow →