IA statistics, step by step · χ² goodness of fit
The χ² goodness-of-fit test, step by step
Do lunchtime library visits spread evenly over the week? The goodness-of-fit test compares observed counts with the counts a model predicts. Every expected frequency, contribution and the decision are worked here.
Example data, invented for this guide. The context is realistic, but the numbers were made up to show the method. Use your own collected or sourced data in your IA.
When to use it
- Counts in categories of one variable.
- A clear model for the expected proportions: equal, known proportions (days in each month, national figures) or a distribution.
- Every expected frequency at least 5.
Course fit: AI SL and HL: the χ² goodness-of-fit test is in the AI SL core. Fitting a binomial, Poisson or normal model and losing a degree of freedom per estimated parameter is covered on the binomial and Poisson page. Not in the AA courses.
The example data
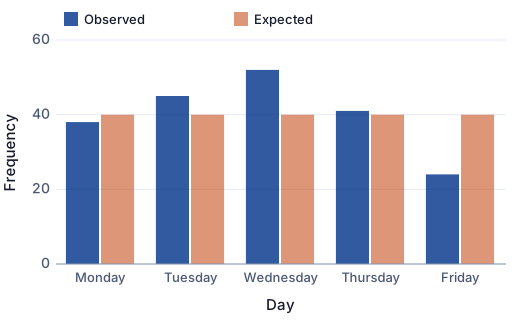
The school library counted lunchtime visitors (one visit per student per day) for one ordinary week: 200 visits in total.
| Day | Count |
|---|---|
| Monday | 38 |
| Tuesday | 45 |
| Wednesday | 52 |
| Thursday | 41 |
| Friday | 24 |
Equal proportions: is every weekday the same?
If visits were spread evenly, each day would expect one fifth of the 200 visits.
Step 1 · Hypotheses and expected frequencies
H0: the categories are equally likely. H1: they do not. Significance level 5%.
E = N × probability, N = 200
Step 2 · Compare observed and expected
| Day | Observed O | Probability | Expected E | (O − E)² / E |
|---|---|---|---|---|
| Monday | 38 | 0.2000 | 40.00 | 0.1000 |
| Tuesday | 45 | 0.2000 | 40.00 | 0.6250 |
| Wednesday | 52 | 0.2000 | 40.00 | 3.600 |
| Thursday | 41 | 0.2000 | 40.00 | 0.02500 |
| Friday | 24 | 0.2000 | 40.00 | 6.400 |
| Σ | 200 | 10.75 |
Smallest expected frequency: 40.00 (0 below 5, so the test can be used).
In the full worked analysis
- The rest of the working: steps 3 to 3
- What the example shows, in context
- On a GDC: TI-84 Plus CE, TI-Nspire CX and Casio fx-CG50
- What examiners look for
- Common mistakes
- Limitations to discuss
How this maps to the IA criteria
- A Criterion A (Presentation): Observed and expected side by side in one table, with the bar chart next to it.
- B Criterion B (Mathematical communication): O, E, χ², ν and p used correctly, and the model stated in words and symbols.
- C Criterion C (Personal engagement): A model chosen for your own context, with expected proportions you have thought about.
- D Criterion D (Reflection): Interpreting where the data depart from the model and what that suggests.
- E Criterion E (Use of mathematics): Expected frequencies, χ², ν and the decision correct.
These are the current criteria A–E, for exams up to November 2028. For the new courses (first assessment May 2029) the IB has confirmed one set of four criteria for SL and HL: A Problem specification (4 marks), B Abstraction (6), C Computation (4) and D Interpretation (6), still 20 marks and 20% of the grade at both levels — see the IB's new AA and AI subject briefs. The detailed descriptors come with the new guide; check with your teacher which criteria apply to you. The advice is our summary, not the IB's wording.
Frequently asked questions
What is the difference between goodness of fit and the test for independence?
Goodness of fit compares one variable's counts with a model's predictions. The test for independence asks whether two categorical variables in a two-way table are linked.
How many degrees of freedom does a goodness-of-fit test have?
ν = (number of categories) − 1 − (number of parameters estimated from the data), counted after any combining.
Can I use a goodness-of-fit test for a normal distribution?
Yes: group the data into classes, find expected counts from the normal model, combine classes so each expected count is at least 5, and subtract two degrees of freedom if you estimated both the mean and the standard deviation.
Next steps
- Criterion E: use of mathematicsWhat “commensurate with the level of the course” means for statistics, at SL and HL.
- Criterion D: reflectionSample, bias, assumptions and causation: where statistics IAs gain or lose marks.
- Plan your statistics IAThe section-by-section framework for a statistics exploration, with your own notes.
- Get feedback on your write-upCriterion-by-criterion feedback on your draft, with evidence from your own text.
- Exemplar: Mid-band draft (Poisson, AI HL)AI HL · a statistics exploration that uses this technique, marked criterion by criterion.
Related: Binomial and Poisson models · Chi-squared test for independence. Or analyse your own data, find a data set in the IA data bank, and see what the IA package adds.
Free: the IA checklist an examiner uses
Every check for Criteria A–E in a 4-page PDF, the mistakes that cost the most marks and a self-assessment grid. We'll email it with a short IA tip every few days, timed to your deadline if you give it. Free — no account, no payment.
While you wait for the email: read the full statistics workflow →