IA statistics, step by step · Cleaning data and outliers
Cleaning data and outliers in a Maths IA: the 1.5 × IQR rule
Raw data are messy. This page finds the outliers in a real-looking data set with the 1.5 × IQR rule, then shows why each one needs its own decision — and how to justify it in your write-up.
Example data, invented for this guide. The context is realistic, but the numbers were made up to show the method. Use your own collected or sourced data in your IA.
When to use it
- Before any calculation: as soon as your data are in a spreadsheet.
- When a value looks impossible, or very far from the rest.
- When you combine data from different sources or people.
Course fit: Every course. The IB defines an outlier as a value more than 1.5 × IQR below the lower quartile or above the upper quartile; box plots and quartiles are in the SL core of AA and AI.
The example data
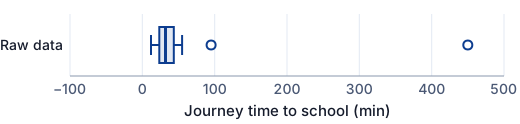
25 students typed their usual door-to-door journey time to school into an online form. One answer is 450 minutes; another is 95 minutes.
12, 15, 18, 20, 22, 22, 25, 25, 26, 28, 30, 30, 32, 33, 35, 35, 38, 40, 42, 45, 48, 50, 55, 95, 450 (min)
The raw data: finding the outliers
First the summary of the data exactly as they arrived, with the fences of the 1.5 × IQR rule.
Step 1 · Put the 25 values in order
12, 15, 18, 20, 22, 22, 25, 25, 26, 28, 30, 30, 32, 33, 35, 35, 38, 40, 42, 45, 48, 50, 55, 95, 450
n = 25. Ordering first makes the median, the quartiles and any outliers easy to see.
Step 2 · Centre: mean and median
x̄ = Σx / n = 1271 / 25 = 50.84
Median: the middle value of the ordered list (value number 13) = 32.00.
In the full worked analysis
- The rest of the working: steps 3 to 4
- After cleaning: one value corrected, one kept
- What the example shows, in context
- On a GDC: TI-84 Plus CE, TI-Nspire CX and Casio fx-CG50
- What examiners look for
- Common mistakes
- Limitations to discuss
How this maps to the IA criteria
- A Criterion A (Presentation): Cleaning described in a short, clear paragraph before the analysis, with raw data in an appendix.
- B Criterion B (Mathematical communication): Fences shown with their calculation, outliers marked on the box plot.
- C Criterion C (Personal engagement): Decisions based on knowing your own data and context — the kind of thinking examiners reward.
- D Criterion D (Reflection): Reflecting on how each decision changes the results and the conclusion.
- E Criterion E (Use of mathematics): Quartiles, IQR and fences calculated correctly, with the method stated.
These are the current criteria A–E, for exams up to November 2028. For the new courses (first assessment May 2029) the IB has confirmed one set of four criteria for SL and HL: A Problem specification (4 marks), B Abstraction (6), C Computation (4) and D Interpretation (6), still 20 marks and 20% of the grade at both levels — see the IB's new AA and AI subject briefs. The detailed descriptors come with the new guide; check with your teacher which criteria apply to you. The advice is our summary, not the IB's wording.
Frequently asked questions
What counts as an outlier in an IB Maths IA?
The IB's definition: a value more than 1.5 × IQR below the lower quartile or above the upper quartile. Use it to identify outliers, then decide what to do with each one.
Should I remove outliers from my IA data?
Only with a reason. Correct checkable errors, remove impossible values or values from outside your population, and keep genuine unusual values — saying what they do to your results.
Does removing outliers lose marks?
Removing them without a reason can. Explaining a sensible decision and showing its effect is good reflection (Criterion D).
Next steps
- Criterion E: use of mathematicsWhat “commensurate with the level of the course” means for statistics, at SL and HL.
- Criterion D: reflectionSample, bias, assumptions and causation: where statistics IAs gain or lose marks.
- Plan your statistics IAThe section-by-section framework for a statistics exploration, with your own notes.
- Get feedback on your write-upCriterion-by-criterion feedback on your draft, with evidence from your own text.
Related: Descriptive statistics and box plots · Sampling and collecting data. Or analyse your own data, find a data set in the IA data bank, and see what the IA package adds.
Free: the IA checklist an examiner uses
Every check for Criteria A–E in a 4-page PDF, the mistakes that cost the most marks and a self-assessment grid. We'll email it with a short IA tip every few days, timed to your deadline if you give it. Free — no account, no payment.
While you wait for the email: read the full statistics workflow →