IA statistics, step by step · Binomial and Poisson models
Binomial and Poisson models: do my counts fit?
Goals in a match, penalties scored out of six: counts often follow a binomial or Poisson model — but only if the conditions hold. This page estimates each model's parameter, builds the expected counts and tests the fit.
Example data, invented for this guide. The context is realistic, but the numbers were made up to show the method. Use your own collected or sourced data in your IA.
When to use it
- Binomial: a fixed number of independent trials, each a success or failure with the same probability.
- Poisson: events happening independently, at a constant average rate, counted in fixed intervals.
- You have a frequency table of counts.
Course fit: The binomial distribution is in the SL core of AA and AI. The Poisson distribution is in AI HL. Testing the fit uses the AI χ² goodness-of-fit test; AA students can compare observed and expected counts, or use the test if they explain it.
New course (first assessment May 2029): the IB has confirmed that the Poisson distribution and the hypothesis test for the population mean of a Poisson distribution are not on the AI HL syllabus from 2029 (AI curriculum updates). You can still use them in an IA if you explain them clearly.
The example data
A student recorded the number of goals scored by the home team in each of the 60 matches of a school five-a-side league season.
| Goals | Frequency |
|---|---|
| 0 | 9 |
| 1 | 17 |
| 2 | 15 |
| 3 | 10 |
| 4 | 6 |
| 5 | 2 |
| 6 | 1 |
A Poisson model for goals per match
Goals happen at random moments during a match, so a Poisson model is a sensible candidate. Its one parameter λ is estimated from the data.
Step 1 · Hypotheses and expected frequencies
H0: the data follow a Poisson distribution. H1: they do not. Significance level 5%.
The mean of the data estimates λ: λ = Σxf / Σf = 1.950. Estimating one parameter from the data costs one extra degree of freedom.
E = N × probability, N = 60
Step 2 · Compare observed and expected
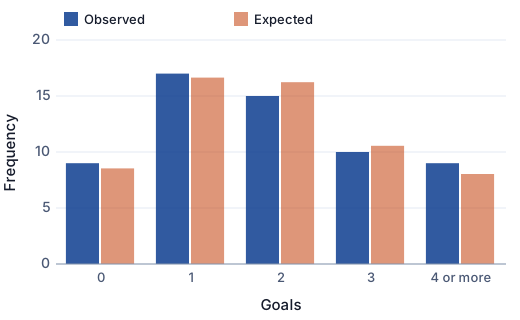
| Goals | Observed O | Probability | Expected E | (O − E)² / E |
|---|---|---|---|---|
| 0 | 9 | 0.1423 | 8.536 | 0.02517 |
| 1 | 17 | 0.2774 | 16.65 | 0.007525 |
| 2 | 15 | 0.2705 | 16.23 | 0.09320 |
| 3 | 10 | 0.1758 | 10.55 | 0.02862 |
| 4 or more | 9 | 0.1340 | 8.038 | 0.1151 |
| Σ | 60 | 0.2696 |
Smallest expected frequency: 8.038 (0 below 5, so the test can be used).
In the full worked analysis
- The rest of the working: steps 3 to 3
- A binomial model for penalties scored
- What the example shows, in context
- On a GDC: TI-84 Plus CE, TI-Nspire CX and Casio fx-CG50
- What examiners look for
- Common mistakes
- Limitations to discuss
How this maps to the IA criteria
- A Criterion A (Presentation): Conditions, model, expected counts and test in a logical order with one clear table.
- B Criterion B (Mathematical communication): X ~ B(n, p) and X ~ Po(λ) notation, with every parameter explained.
- C Criterion C (Personal engagement): A model you justify from your own context, and conditions you question honestly.
- D Criterion D (Reflection): Reflecting on whether the conditions really hold and what the test can show.
- E Criterion E (Use of mathematics): Correct probabilities, expected counts, degrees of freedom and decision.
These are the current criteria A–E, for exams up to November 2028. For the new courses (first assessment May 2029) the IB has confirmed one set of four criteria for SL and HL: A Problem specification (4 marks), B Abstraction (6), C Computation (4) and D Interpretation (6), still 20 marks and 20% of the grade at both levels — see the IB's new AA and AI subject briefs. The detailed descriptors come with the new guide; check with your teacher which criteria apply to you. The advice is our summary, not the IB's wording.
Frequently asked questions
How do I know if my data follow a Poisson distribution?
Check the conditions in context (independent events, constant rate), compare the mean and variance (roughly equal for Poisson), then compare observed and expected counts — with a χ² goodness-of-fit test if your course has it.
How many degrees of freedom when I estimate λ or p?
Subtract one more: ν = (number of categories after combining) − 1 − 1.
Is the Poisson distribution in AA?
No — it is in AI HL for exams up to 2028, and the IB has confirmed it is not in the new AI HL course (first assessment 2029). Any student can still use it in an IA if they explain it clearly.
Next steps
- Criterion E: use of mathematicsWhat “commensurate with the level of the course” means for statistics, at SL and HL.
- Criterion D: reflectionSample, bias, assumptions and causation: where statistics IAs gain or lose marks.
- Plan your statistics IAThe section-by-section framework for a statistics exploration, with your own notes.
- Get feedback on your write-upCriterion-by-criterion feedback on your draft, with evidence from your own text.
- Exemplar: Mid-band draft (Poisson, AI HL)AI HL · a statistics exploration that uses this technique, marked criterion by criterion.
Related: Chi-squared goodness of fit · Is my data normal?. Or analyse your own data, find a data set in the IA data bank, and see what the IA package adds.
Free: the IA checklist an examiner uses
Every check for Criteria A–E in a 4-page PDF, the mistakes that cost the most marks and a self-assessment grid. We'll email it with a short IA tip every few days, timed to your deadline if you give it. Free — no account, no payment.
While you wait for the email: read the full statistics workflow →