IA statistics, step by step · Choosing the right test
Choosing the right statistical test for your Maths IA
Start from your question and the type of data you have, not from the test you have heard of. This page matches the common IA questions to the right technique, with the conditions each one needs.
When to use it
- You have a research question and know roughly what data you will collect.
- You are unsure whether your data are numerical, ranked or categorical.
- You want to check a test's conditions before you collect, not after.
Course fit: AA courses: descriptive statistics, Pearson's r, regression, and the binomial and normal distributions. AI SL adds Spearman's rank, χ² tests and the two-sample t-test; AI HL adds tests for one mean, Poisson models and confidence intervals. Techniques from outside your course are allowed in an IA if you explain them clearly.
How to choose, in five steps
Write the question as a comparison or a relationship
“Is there a relationship between …?”, “Do … and … differ?”, “Is … linked to …?”, “Does … follow …?” The wording points at the family of techniques.
Name each variable's type
Numerical (measured: time, mass, score), ranked (an order only), or categorical (labels: year group, yes/no). Paired or independent?
Pick the technique from the table
The table below matches each question type to a technique, with the courses it belongs to.
Check its conditions before you collect
Expected frequencies at least 5 (χ²), roughly normal data and similar spreads (t-test), a straight-line pattern (Pearson). Plan a sample big enough to meet them.
Plan the graph that goes with it
Scatter graph for relationships, box plots for comparing groups, a bar chart of observed and expected for χ², a histogram for normality.
The decision table
| Your question | Your data | Use | Courses |
|---|---|---|---|
| What is typical, and how spread out is it? | One numerical variable | Mean or median, IQR or standard deviation, a box plot or histogram | All courses |
| Are there odd values I should deal with? | Any numerical variable | The 1.5 × IQR rule, then a decision you justify | All courses |
| As one measurement goes up, does the other change in a straight line? | Two numerical variables, paired by individual | Pearson's r, r² and the regression line of y on x | All courses (testing r: AI HL) |
| Do they rise or fall together, even if not in a straight line? | Two variables you can rank | Spearman's rank correlation coefficient rₛ | AI SL and HL |
| Are two categorical variables linked? | Counts in a two-way table | χ² test for independence | AI SL and HL |
| Do my counts match an expected pattern or model? | Counts in categories | χ² goodness-of-fit test | AI SL and HL |
| Do two separate groups have different means? | One numerical variable, two independent groups | Pooled two-sample t-test | AI SL and HL |
| Did the same individuals change? | Two measurements on each individual | Paired t-test on the differences | AI HL (a test for one mean) |
| Is a normal model reasonable for my data? | One numerical variable | Histogram, mean vs median, the 68–95–99.7 check | All courses |
| How precisely does my sample estimate the population mean? | One numerical sample | A t confidence interval for the mean | AI HL |
| Do my counts follow a binomial or Poisson model? | Counts of successes or events | The model's probabilities, then a χ² goodness-of-fit test | Binomial: all; Poisson: AI HL |
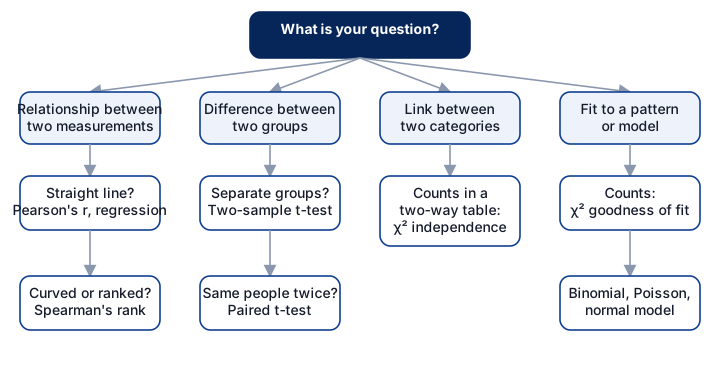
Course labels follow the current IB guides (first assessment 2021). A technique from outside your course is fine in an IA if you explain it.
What examiners look for
- The technique answers the research question that was asked — not a technique chosen first and a question fitted around it.
- The choice is justified: why this test and not another, with its conditions checked on the actual data.
- Fewer techniques, explained and interpreted well, rather than many calculations with no discussion.
- Mathematics commensurate with the course: an AI HL exploration that only calculates a mean will struggle on Criterion E.
Common mistakes
- Running every test the GDC offers and reporting all of them.
- Using Pearson's r on a curved relationship, or on ranked data.
- A χ² test on percentages or means instead of counts.
- A two-sample t-test on paired data (the same people twice).
- Changing the question after seeing the results without saying so.
Limitations to discuss
- Every test answers a narrow question about a population; your conclusion is only as good as your sample.
- Not significant does not mean no effect: it means not enough evidence with this sample.
- Statistical significance is not the same as a difference that matters in real life.
How this maps to the IA criteria
- A Criterion A (Presentation): A clear aim that says which question the statistics will answer, and a structure that follows from it.
- B Criterion B (Mathematical communication): Correct notation (H₀, H₁, χ², rₛ, p) and every variable defined with units.
- C Criterion C (Personal engagement): Choosing the technique for your own question and data, and saying why — not following a template.
- D Criterion D (Reflection): Discussing the conditions and limitations of the technique you chose, and what it can and cannot show.
- E Criterion E (Use of mathematics): A technique that is correct, relevant and commensurate with your course, carried out accurately.
These are the current criteria A–E, for exams up to November 2028. For the new courses (first assessment May 2029) the IB has confirmed one set of four criteria for SL and HL: A Problem specification (4 marks), B Abstraction (6), C Computation (4) and D Interpretation (6), still 20 marks and 20% of the grade at both levels — see the IB's new AA and AI subject briefs. The detailed descriptors come with the new guide; check with your teacher which criteria apply to you. The advice is our summary, not the IB's wording.
Frequently asked questions
Which statistical test should I use in my Maths IA?
It depends on your question and your data. Relationships between two measurements: correlation and regression (Pearson's r or Spearman's rank). Links between two categories: a χ² test for independence. Counts against an expected pattern: χ² goodness of fit. Comparing two group means: a t-test. Use the table on this page to match them.
Can I use a test that is not in my course?
Yes, if you explain it clearly, show you understand its conditions and use it correctly. Examiners credit understanding, so a technique you cannot explain does not help.
Is it enough to calculate a mean and a standard deviation?
Usually not on its own. Descriptive statistics are where you start; Criterion E looks for mathematics commensurate with your course, which for AI usually means a test or model as well.
Next steps
- Criterion E: use of mathematicsWhat “commensurate with the level of the course” means for statistics, at SL and HL.
- Criterion D: reflectionSample, bias, assumptions and causation: where statistics IAs gain or lose marks.
- Plan your statistics IAThe section-by-section framework for a statistics exploration, with your own notes.
- Get feedback on your write-upCriterion-by-criterion feedback on your draft, with evidence from your own text.
- Exemplar: Mid-band draft (statistics)AI SL · a statistics exploration that uses this technique, marked criterion by criterion.
Related: Descriptive statistics and box plots · Sampling and collecting data. Or analyse your own data, find a data set in the IA data bank, and see what the IA package adds.
Free: the IA checklist an examiner uses
Every check for Criteria A–E in a 4-page PDF, the mistakes that cost the most marks and a self-assessment grid. We'll email it with a short IA tip every few days, timed to your deadline if you give it. Free — no account, no payment.
While you wait for the email: read the full statistics workflow →