IA statistics, step by step · Box plots and comparing distributions
Descriptive statistics and box plots: comparing two distributions
Before any test, describe. This page summarises two groups of step counts — centre, spread, shape and outliers — and draws the box plots that let you compare them at a glance.
Example data, invented for this guide. The context is realistic, but the numbers were made up to show the method. Use your own collected or sourced data in your IA.
When to use it
- Always, as the first stage of any statistics IA.
- Comparing two or more groups on the same numerical variable.
- Deciding whether a test's conditions (normality, similar spread) are plausible.
Course fit: Every course: measures of central tendency and dispersion, quartiles, box-and-whisker diagrams and comparing two distributions with them are in the SL core of AA and AI.
The example data
Thirty students in one year group wore a step counter for a day: 15 chosen at random wore it on a school day, a different 15 on a weekend day.
| School day (thousand steps) | Weekend day (thousand steps) | |
|---|---|---|
| 1 | 6.2 | 2.1 |
| 2 | 7.8 | 3.4 |
| 3 | 8.1 | 4 |
| 4 | 8.5 | 4.6 |
| 5 | 9 | 5.2 |
| 6 | 9.3 | 5.9 |
| 7 | 9.7 | 6.3 |
| 8 | 10.1 | 6.8 |
| 9 | 10.4 | 7.5 |
| 10 | 10.8 | 8.2 |
| 11 | 11.2 | 9.1 |
| 12 | 11.9 | 10.6 |
| 13 | 12.5 | 12.3 |
| 14 | 13.4 | 14.8 |
| 15 | 16.8 | 18.9 |
Group 1: school day
The 15 school-day values, summarised step by step.
Step 1 · Put the 15 values in order
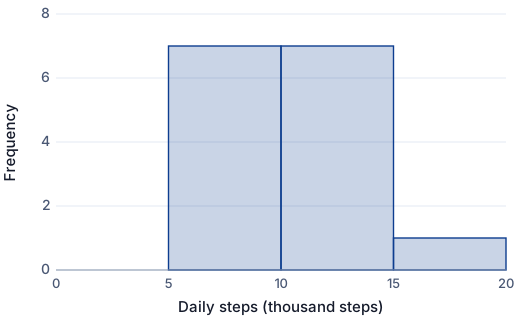
6.2, 7.8, 8.1, 8.5, 9, 9.3, 9.7, 10.1, 10.4, 10.8, 11.2, 11.9, 12.5, 13.4, 16.8
n = 15. Ordering first makes the median, the quartiles and any outliers easy to see.
Step 2 · Centre: mean and median
x̄ = Σx / n = 155.7 / 15 = 10.38
Median: the middle value of the ordered list (value number 8) = 10.10.
Step 3 · Spread: quartiles, IQR and standard deviation
Lower quartile Q1 = 8.500, upper quartile Q3 = 11.90 (the medians of the lower and upper halves, leaving out the median itself — the method GDCs use).
IQR = Q3 − Q1 = 11.90 − 8.500 = 3.400
Range = 16.8 − 6.2 = 10.60
Σ(x − x̄)² = 94.464, σ = √(94.464 / 15) = 2.510
That is the standard deviation of these values (σ, what a GDC calls σx). To estimate the spread of the whole population from a sample, divide by n − 1 instead: sn−1 = 2.598 (GDC: Sx). Say which one you use.
Step 4 · Outliers: the 1.5 × IQR rule
Lower fence = Q1 − 1.5 × IQR = 3.400, upper fence = Q3 + 1.5 × IQR = 17.00
No value is outside the fences (0 outliers).
Group 2: weekend day
The same summary for the 15 weekend-day values.
Step 1 · Put the 15 values in order
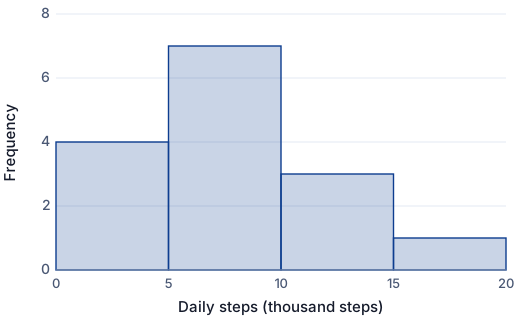
2.1, 3.4, 4, 4.6, 5.2, 5.9, 6.3, 6.8, 7.5, 8.2, 9.1, 10.6, 12.3, 14.8, 18.9
n = 15. Ordering first makes the median, the quartiles and any outliers easy to see.
Step 2 · Centre: mean and median
x̄ = Σx / n = 119.7 / 15 = 7.980
Median: the middle value of the ordered list (value number 8) = 6.800.
Step 3 · Spread: quartiles, IQR and standard deviation
Lower quartile Q1 = 4.600, upper quartile Q3 = 10.60 (the medians of the lower and upper halves, leaving out the median itself — the method GDCs use).
IQR = Q3 − Q1 = 10.60 − 4.600 = 6.000
Range = 18.9 − 2.1 = 16.80
Σ(x − x̄)² = 291.90, σ = √(291.90 / 15) = 4.411
That is the standard deviation of these values (σ, what a GDC calls σx). To estimate the spread of the whole population from a sample, divide by n − 1 instead: sn−1 = 4.566 (GDC: Sx). Say which one you use.
Step 4 · Outliers: the 1.5 × IQR rule
Lower fence = Q1 − 1.5 × IQR = −4.400, upper fence = Q3 + 1.5 × IQR = 19.60
No value is outside the fences (0 outliers).
What the example shows
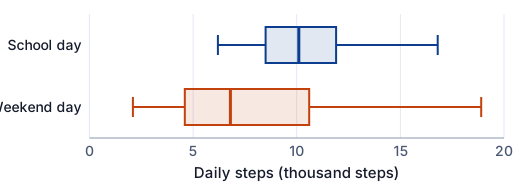
- Centre: the school-day median (10.1 thousand steps) is higher than the weekend median (6.80 thousand).
- Spread: the weekend IQR (6.00) is much larger than the school-day IQR (3.40): weekend days vary far more between students.
- Shape: on the weekend the mean (7.98) is above the median, with a long upper whisker — a positive skew. A few very active students pull the mean up.
- Outliers: none in either group by the 1.5 × IQR rule (0 and 0), although the school-day value of 16.8 thousand is close to the upper fence of 17.0. Check unusual values before deciding anything — see cleaning data and outliers.
This is our interpretation of invented example data, to show the kind of thinking examiners reward. Your interpretation must be your own, about your own data.
On a GDC
Enter the data first, then use the menu below. Menus differ slightly between operating systems; check your calculator's manual.
- TI-84 Plus CE: [stat] → EDIT, data in L1; [stat] → CALC → 1-Var Stats. It gives x̄, Σx, Sx, σx, n, minX, Q1, Med, Q3 and maxX.
- TI-Nspire CX: Lists & Spreadsheet, then menu → Statistics → Stat Calculations → One-Variable Statistics.
- Casio fx-CG50: STAT mode, data in List 1; CALC → 1-VAR (check SET points at List 1).
Show one calculation by hand in your IA so the examiner sees you understand it, then say which technology did the rest.
What examiners look for
- Comparisons use both centre and spread, in context and with units — not just “group A is bigger”.
- The choice between mean/standard deviation and median/IQR is justified by the shape of the data.
- Graphs are drawn on the same scale so they can be compared, labelled and discussed in the text.
- Only statistics that are used later are calculated.
Common mistakes
- Box plots on different scales, or without a labelled axis.
- Listing every summary statistic with no comment.
- Saying the mean of skewed data is “typical”.
- Comparing groups of very different sizes without saying so.
- Calling a sample standard deviation σ (it is s, or σ for the data set itself — say which).
Limitations to discuss
- Two samples of 15 describe these students on these days; generalising to all students needs a random sample and a test.
- Step counters differ in accuracy, especially for cycling or carrying a bag.
- Each student was measured on one day only.
How this maps to the IA criteria
- A Criterion A (Presentation): Box plots placed next to the comparison that uses them, with a table of the key statistics.
- B Criterion B (Mathematical communication): Median, quartiles and IQR defined, symbols used correctly (x̄, σ or s), units given.
- C Criterion C (Personal engagement): Noticing what is interesting about your groups — the spread, the skew, one unusual student — and following it up.
- D Criterion D (Reflection): Saying what the comparison shows and what it cannot show (a sample, one day).
- E Criterion E (Use of mathematics): Correct statistics with the quartile method stated, and graphs drawn accurately.
These are the current criteria A–E, for exams up to November 2028. For the new courses (first assessment May 2029) the IB has confirmed one set of four criteria for SL and HL: A Problem specification (4 marks), B Abstraction (6), C Computation (4) and D Interpretation (6), still 20 marks and 20% of the grade at both levels — see the IB's new AA and AI subject briefs. The detailed descriptors come with the new guide; check with your teacher which criteria apply to you. The advice is our summary, not the IB's wording.
Frequently asked questions
How do I compare two box plots in a Maths IA?
Compare the medians (centre), the IQRs and ranges (spread), the shape (symmetry or skew) and any outliers, in context and with units, and say how much the boxes overlap.
Should I use the mean or the median in my IA?
The median and IQR when the data are skewed or have outliers; the mean and standard deviation when the data are roughly symmetric and you plan tests that use them. Say why you chose.
Which standard deviation should I use?
σ (dividing by n) describes the data you have; s (dividing by n − 1) estimates the population's standard deviation from a sample and is what t-tests use. Say which one you report.
Next steps
- Criterion E: use of mathematicsWhat “commensurate with the level of the course” means for statistics, at SL and HL.
- Criterion D: reflectionSample, bias, assumptions and causation: where statistics IAs gain or lose marks.
- Plan your statistics IAThe section-by-section framework for a statistics exploration, with your own notes.
- Get feedback on your write-upCriterion-by-criterion feedback on your draft, with evidence from your own text.
- Exemplar: Bus lateness and rain (AI SL)AI SL · a statistics exploration that uses this technique, marked criterion by criterion.
Related: Cleaning data and outliers · t-test: two-sample and paired. Or analyse your own data, find a data set in the IA data bank, and see what the IA package adds.
Free: the IA checklist an examiner uses
Every check for Criteria A–E in a 4-page PDF, the mistakes that cost the most marks and a self-assessment grid. We'll email it with a short IA tip every few days, timed to your deadline if you give it. Free — no account, no payment.
While you wait for the email: read the full statistics workflow →