Sinusoidal regression calculator
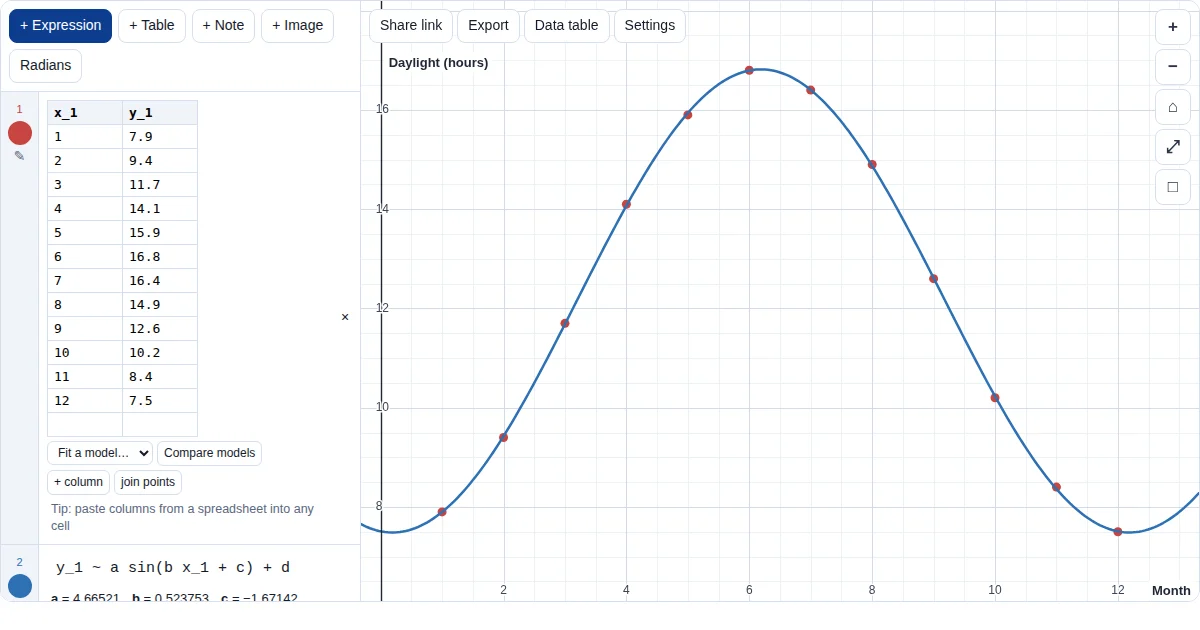
For data that repeat, such as daylight hours, tides or temperatures over a year, fit a sine curve in one line. The Grapher finds a good starting point itself, so you do not have to guess the period.
How to do it
- Enter your data. Paste or type the table. Use radians (the default): the period then comes out as 2π/b.
- Type the sine model. Type
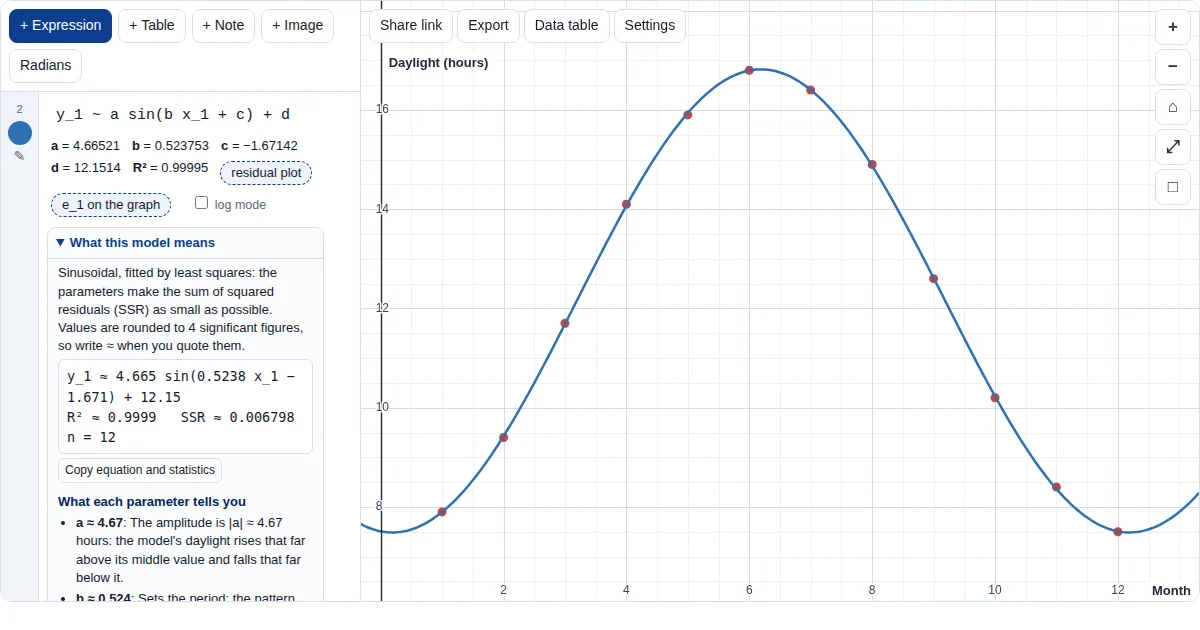
y_1 ~ a sin(b x_1 + c) + d(or with cos). If you know the period, fix it:b = 2pi/12on its own line holds b fixed in the fit. - Read the features. |a| is the amplitude, 2π/b the period and d the principal axis. What this model means words each one with your axis labels.
- Check the residuals. Open the residual plot. Real periodic data are rarely a perfect sine curve: say what the pattern in the residuals tells you.
Good to know
- A GDC's SinReg needs radian mode; so does this model's period 2π/b.
- Many sets of parameters describe the same curve (a negative a with a shifted c, for example). The Grapher gives one of them; check it against the context.
Frequently asked questions
Do I need to guess the period first?
No. The Grapher searches for a good starting point itself before refining the fit. You can still fix the period yourself by defining b on its own line, for example b = 2pi/12.
How do I get the amplitude and period?
The amplitude is |a| and the period is 2π/b (in radians). The principal axis is y = d. “What this model means” lists them for your data.
Is it the same as SinReg on my GDC?
Both fit y = a sin(bx + c) + d by least squares. They can report different but equivalent parameters (for example a and c with different signs) for the same curve.
Learn more
- Sinusoidal model, worked
- Sinusoidal models (AI SL notes)
- Sinusoidal modelling (AI HL notes)
- Regression on your GDC
- IA modelling, step by step
More Grapher guides
The Grapher is our own free tool (graph.mathrevision.co.uk), built for IB, A Level and IGCSE students. It is not an exam calculator: practise on your own GDC for calculator papers.