Table of values calculator with graph
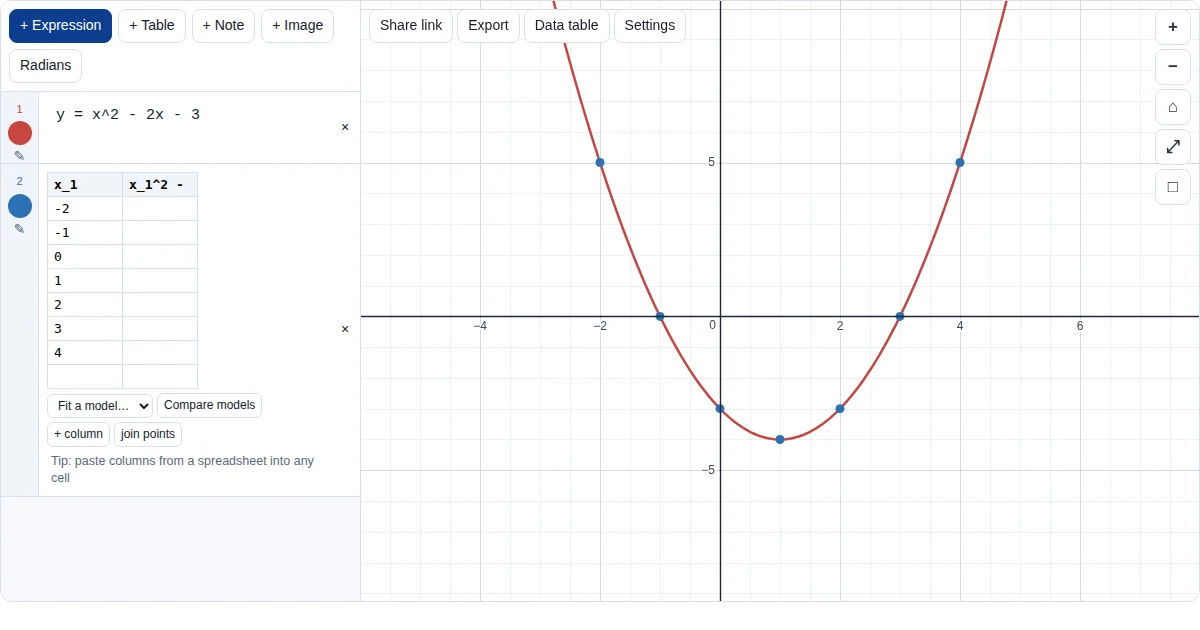
Type a function, tap table of values, and get a table of x and y values that you can edit, with the points plotted on the graph.
How to do it
- Type the function. For example
y = x^2 - 2x - 3. - Make the table. Tap the curve to select it, then tap table of values under its line. A table appears with x values from the graph's window and a second column worked out from the function.
- Change the x values. Edit or add x values in the first column; the y column updates. Use a step of 0.5 or 0.1 near a turning point.
- Use a column heading as a formula. A column heading like
x_1^2 - 2x_1 - 3is a computed column, so you can add more columns for other functions of the same x values.
Good to know
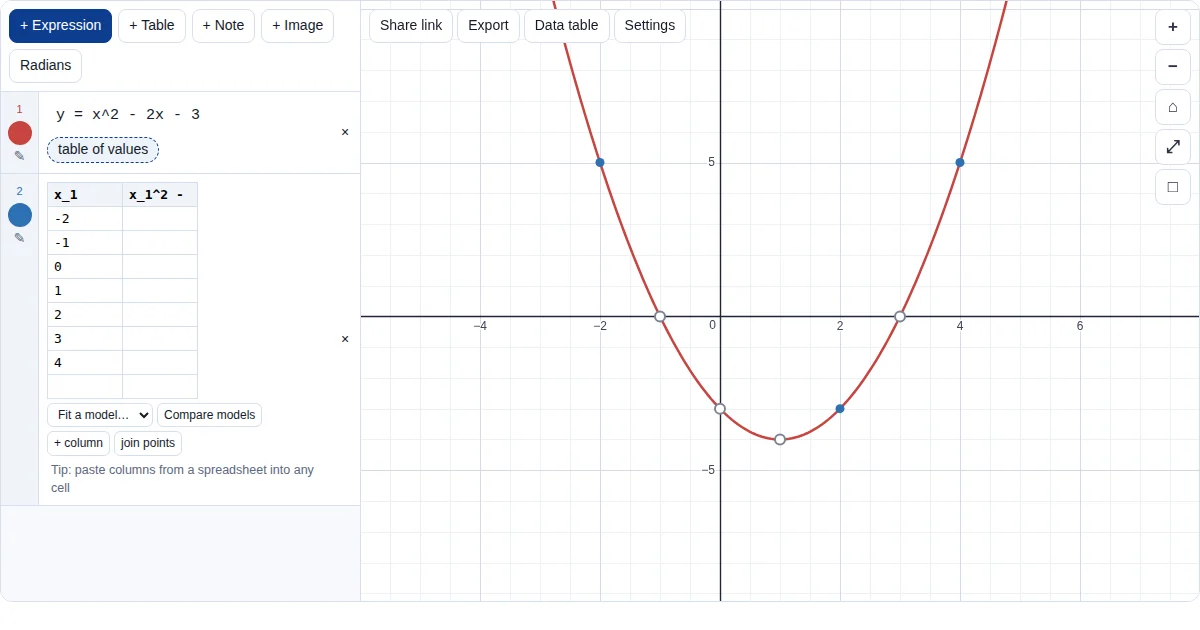
- The table's points are drawn on the graph, so you can see a mistake straight away.
- Data table under the graph lists the values and the points of interest for a screen reader.
Frequently asked questions
How do I make a table of values for a function?
Type the function, tap its curve and tap “table of values”. Or make a table yourself with a first column x_1 and a second column whose heading is the function of x_1.
Can I change the step size?
Yes: type the x values you want in the first column (for example −2, −1.5, −1 …) and the second column is recalculated.
Is it like the table on a GDC?
It does the same job as a GDC's table of a function, with the points plotted on the graph next to it.
Learn more
- GDC: tables of values
- Quadratic functions (AI SL notes)
- Graphs of common functions
- Quadratics and the discriminant (AA SL notes)
More Grapher guides
The Grapher is our own free tool (graph.mathrevision.co.uk), built for IB, A Level and IGCSE students. It is not an exam calculator: practise on your own GDC for calculator papers.