Find intersections, roots and turning points on a graph
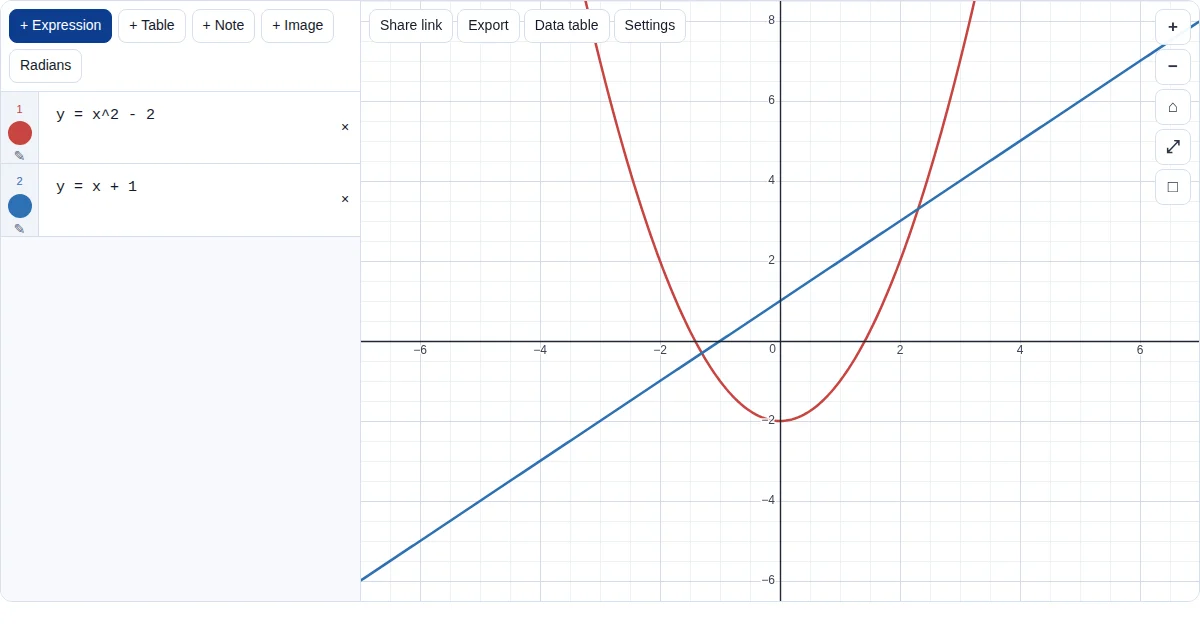
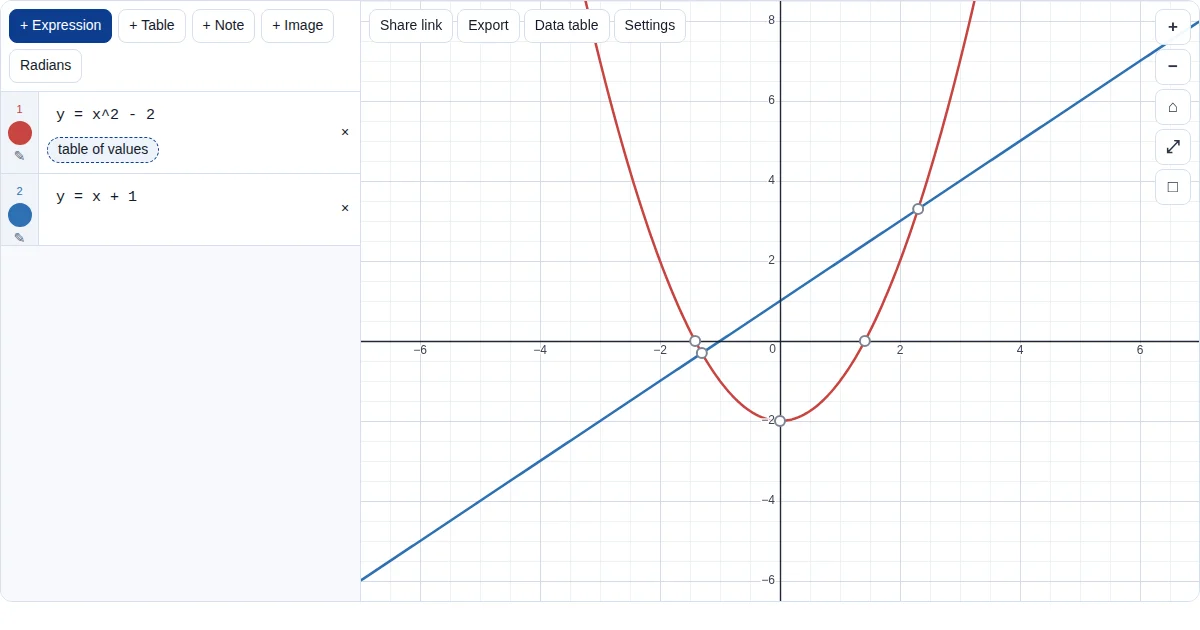
Plot two or more curves and tap one: grey dots mark its roots, maximum and minimum points, y-intercept and intersections with the other curves. Tap a dot for its coordinates.
How to do it
- Type the curves. One per line, for example
y = x^2 - 2andy = x + 1. - Tap a curve. Grey dots appear at its roots (x-intercepts), turning points, y-intercept and its intersections with the other curves.
- Tap a dot. Its coordinates appear in a label. Values are found numerically to many significant figures; round them as the question asks.
- Trace along the curve. Drag along the curve to read coordinates anywhere on it.
Good to know
- To solve f(x) = g(x), graph y = f(x) and y = g(x) and read off the x-coordinates of the intersections.
- Turning points are found numerically. Show the calculus in an exam answer: set dy/dx = 0 and solve.
- On AA Paper 1 there is no calculator, so practise the algebra too.
Frequently asked questions
How do I find where two graphs intersect?
Type both curves, then tap one of them: grey dots mark the intersections with the other curves. Tap a dot for its coordinates.
How do I find the maximum or minimum of a function?
Tap the curve. Its turning points are marked with grey dots; tap one for its coordinates.
How accurate are the values?
They are found numerically to many more significant figures than you need. Round them as the question asks, usually 3 significant figures.
Learn more
- GDC: intersections, zeros, max and min
- Differentiation (AA SL notes)
- Optimisation (AI SL notes)
- Quadratics and the discriminant (AA SL notes)
- Graphs of common functions
More Grapher guides
The Grapher is our own free tool (graph.mathrevision.co.uk), built for IB, A Level and IGCSE students. It is not an exam calculator: practise on your own GDC for calculator papers.