Free IB Maths AA SL lesson: Presenting data: histograms, cumulative frequency & box plots
A ready-to-teach IB Maths AA SL lesson on Presenting data: histograms, cumulative frequency & box plots (Unit 4 · Statistics & Probability): editable slides and teacher notes, free; a printable worksheet in 3 levels with answers for school plans. About 55 minutes.
This lesson is about showing data and reading it back: histograms of grouped data, cumulative frequency graphs for the median, quartiles and percentiles, and box-and-whisker diagrams with the 1.5 × IQR test for outliers. It ends with two box plots side by side, compared by their medians and spreads.
Free with a teacher account. Sign in with Google, Microsoft or email and download the slides and teacher notes.
What's inside
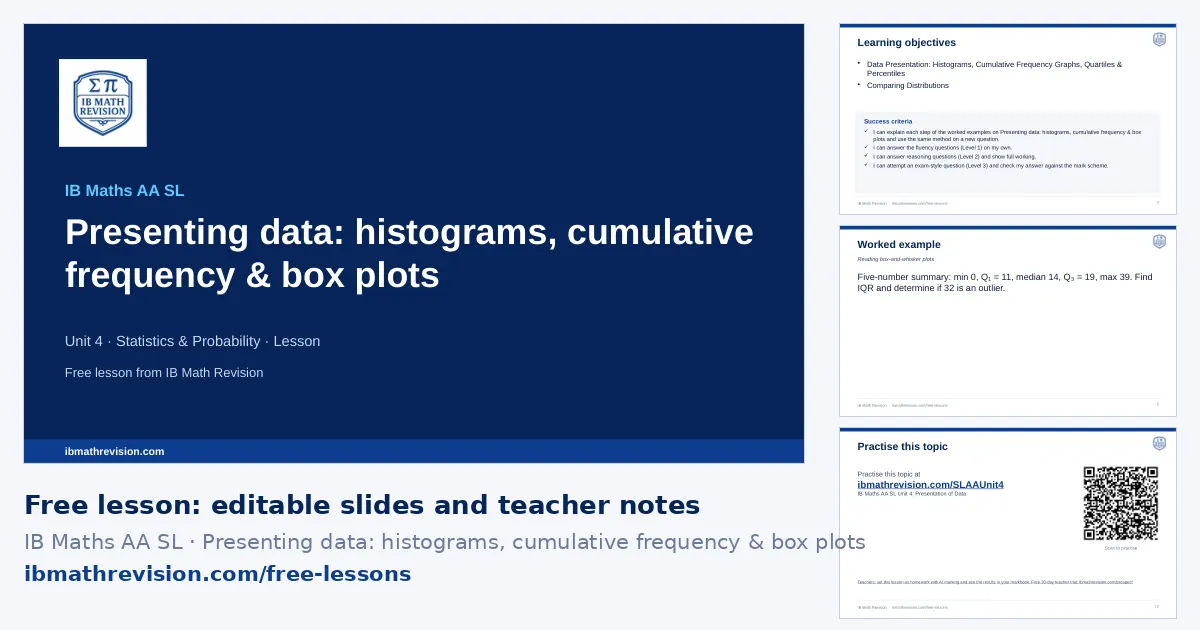
- Slides (PowerPoint, editable) · freeabout 12 slides: do now, objectives, key ideas, a worked example step by step, “your turn”, practice QR code, exit ticket
- Teacher notes (PDF) · freelesson plan with timings, common mistakes, homework links
- Worksheet (PDF) · school plans6 questions, 35 marks: Fluency, Reasoning, Exam-style. Included with school plans and the teacher trial.
- Answers (PDF) · school plansthe answer to every worksheet question, from its mark scheme. Included with school plans and the teacher trial.
Learning objectives
- Data Presentation: Histograms, Cumulative Frequency Graphs, Quartiles & Percentiles
- Comparing Distributions
Key ideas on the slides
- Cumulative frequency is plotted at the upper class boundary; read the median at n/2, quartiles at n/4 and 3n/4, and percentiles at the matching fraction.
- Histogram: frequency density = frequency/(class width); the area of each bar is proportional to its frequency.
- Estimate the number in part of a class by the fraction of its width (linear interpolation).
- With a scale question, find the frequency represented by one unit of area first.
By the end of the lesson, students should be able to answer a question like: Use a cumulative frequency graph of 80 times to estimate the median and the interquartile range.
Skills in this topic
Presenting data: histograms, cumulative frequency & box plots breaks down into 3 skills. In the worksheet builder, teachers can set practice on just one of them.
- Histograms: Draw and read a histogram of grouped data, including the modal class and estimates from it.
- Cumulative frequency graphs: Draw a cumulative frequency graph and read the median, quartiles and percentiles.
- Box plots, quartiles & outliers: Read and draw box plots, find quartiles and the IQR, and test for outliers.
Key vocabulary
- cumulative frequency: The running total of frequencies.
- frequency density: Frequency per unit of class width.
- class boundary: The value where one class ends and the next begins.
- quartile: One of the values that split the ordered data into four equal parts.
- interquartile range: Q₃ − Q₁, the spread of the middle 50%.
Worked example: Presenting data: histograms, cumulative frequency & box plots
A data set has lower quartile 24, upper quartile 40 and largest value 66. Is 66 an outlier?
- IQR = 40 − 24 = 16.
- Upper fence = Q₃ + 1.5 × IQR = 40 + 24 = 64.
- 66 is above 64.
Answer: Yes: 66 is an outlier
Common mistakes in presenting data: histograms, cumulative frequency & box plots
- Using 1.5 × the range instead of 1.5 × the IQR.
- Plotting cumulative frequency at the class midpoints instead of the upper class boundaries.
- Comparing two box plots by their medians only: compare a measure of spread as well.
The worked example
Five-number summary: min 0, Q₁ = 11, median 14, Q₃ = 19, max 39. Find IQR and determine if 32 is an outlier.
- IQR: Q₃ − Q₁ = 19 − 11 = 8.
- Upper boundary: Q₃ + 1.5 × IQR = 19 + 12 = 31.
- Compare: 32 > 31, so 32 is a mathematical outlier.
Tip: Show the numerical boundary value AND the inequality comparison (32 > 31) to secure the reasoning mark.
Calculator tips
- Enter midpoints and frequencies for summary statistics; draw the histogram by hand with frequency density.
- 1-Var Stats gives Q₁, median and Q₃; the statistical plot draws a modified box plot with outliers.
Where this lesson fits
Presenting data: histograms, cumulative frequency & box plots is in Unit 4 · Statistics & Probability of the IB Maths AA SL scheme of work.
- The lesson before: Measures of spread (SD, IQR) (scheme-of-work lessons: Variance & Standard Deviation; Dispersion: Box-and-Whisker Diagrams, IQR & Outliers)
- The next lesson: Least-squares regression line (scheme-of-work lessons: Line of Best Fit & Linear Regression; The Regression Line of x on y & Which Line to Use; Using the x-on-y Line)
Lesson plan
| 0–5 min | Do now: students write down what they remember about Measures of spread (SD, IQR) and Central tendency (mean/median/mode) |
| 5–8 min | Share the learning objective and success criteria |
| 8–20 min | Teach: the worked example, step by step; students copy the method |
| 20–25 min | Your turn: 1 mini-whiteboard question; check every board before moving on |
| 25–42 min | Practise: the worksheet (6 questions in 3 levels, with school plans and the teacher trial) or the topic's practice questions online; move up a level after two right in a row |
| 42–47 min | Plenary: 1-question exit ticket; collect it to plan the next lesson |
For students: practise this topic
The worksheet's QR code opens the IB Maths AA SL Unit 4: Presentation of Data practice questions.
With a school plan
Set Presenting data: histograms, cumulative frequency & box plots as homework marked by AI, print this lesson's levelled worksheet with answers, and rebuild the lesson for your class with Create lesson. Free for 30 days as a teacher, no card.
Is it free, can I edit the slides, what do students use for homework? See questions teachers ask.