Free IB Maths AA SL and AI SL lesson: Least-squares regression line
A ready-to-teach IB Maths AA SL and AI SL lesson on Least-squares regression line: editable slides and teacher notes, free; a printable worksheet in 3 levels with answers for school plans. About 55 minutes.
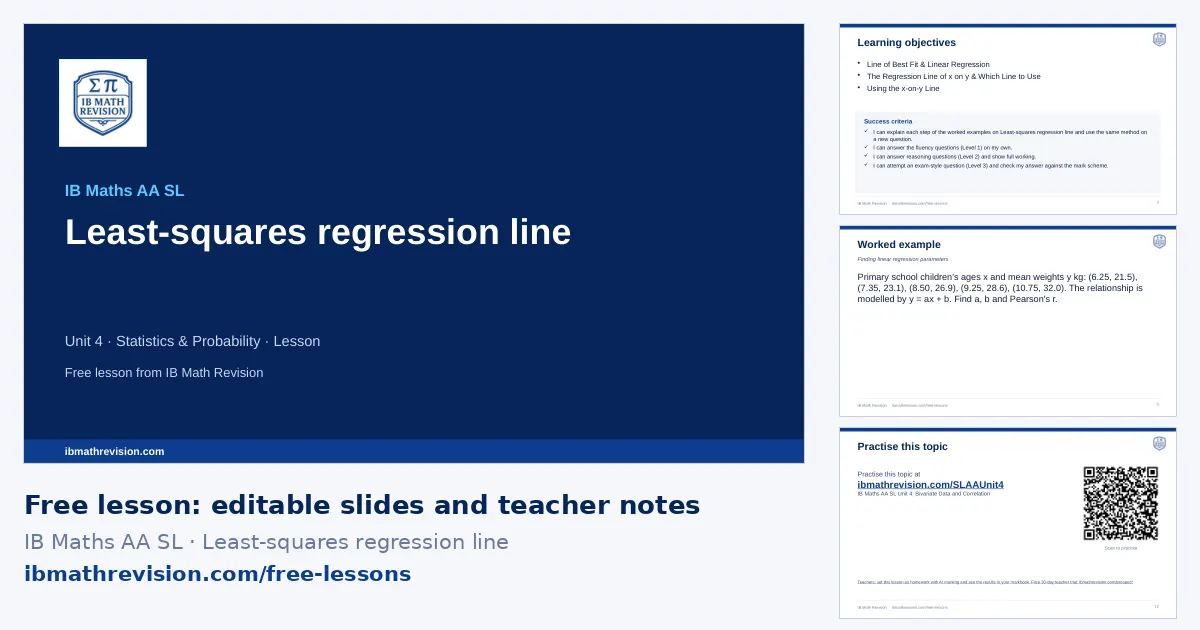
Free with a teacher account. Sign in with Google, Microsoft or email and download the slides and teacher notes.
One lesson for AA SL and AI SL
Least-squares regression line is taught in IB Maths AA SL and IB Maths AI SL, with the same key ideas. Choose your course above the download button: each version's slides use that course's own worked example, questions and practice link.
- AA SL (Unit 4 · Statistics & Probability): Line of Best Fit & Linear Regression; The Regression Line of x on y & Which Line to Use; Using the x-on-y Line
- AI SL (Unit 4 · Statistics & Probability): Line of Best Fit & Linear Regression; Interpreting r and the Regression Line; Bivariate Data: Interpreting Regression Parameters & the Dangers of Extrapolation; Regression with Technology & Interpreting a and b
What's inside
- Slides (PowerPoint, editable) · freeabout 12 slides: do now, objectives, key ideas, a worked example step by step, “your turn”, practice QR code, exit ticket
- Teacher notes (PDF) · freelesson plan with timings, common mistakes, homework links
- Worksheet (PDF) · school plans6 questions, 31 marks: Fluency, Reasoning, Exam-style. Included with school plans and the teacher trial.
- Answers (PDF) · school plansthe answer to every worksheet question, from its mark scheme. Included with school plans and the teacher trial.
Learning objectives (AA SL)
- Line of Best Fit & Linear Regression
- The Regression Line of x on y & Which Line to Use
- Using the x-on-y Line
Key ideas on the slides
- A linear model y = mx + c: m is the rate of change (e.g. cost per item) and c is the fixed amount (e.g. fixed cost).
- Profit = revenue − cost; break-even is where revenue = cost (profit = 0).
- A piecewise linear function uses different linear rules on different intervals; check the pieces meet where they should.
- Interpret parameters with units and in context, and state when the model stops being valid.
By the end of the lesson, students should be able to answer a question like: Estimate y when x=5 using regression line y = 2.5x + 3.
Skills in this topic
Least-squares regression line breaks down into 3 skills. In the worksheet builder, teachers can set practice on just one of them.
- Regression line from data & estimates: Find the y-on-x regression line from a table with a GDC and use it to estimate a value.
- Regression line through the mean point: Use the fact that the line passes through (x̄, ȳ) to find a missing mean, constant or value.
- y on x or x on y?: Pick the right regression line for the value you need to estimate, and use the x-on-y line.
Key vocabulary
- linear model: A relationship of the form y = mx + c used to describe a situation.
- break-even point: Where total revenue equals total cost.
- piecewise function: A function defined by different rules on different parts of its domain.
- regression line: The line of best fit that minimises the sum of squared vertical distances.
- interpolation: Predicting within the range of the data.
Common mistakes this lesson tackles
- Describing the gradient without units or context.
- Solving revenue = profit instead of revenue = cost.
- Using the model outside the domain where it applies.
- Using the y-on-x line to predict x.
The worked example
Primary school children's ages x and mean weights y kg: (6.25, 21.5), (7.35, 23.1), (8.50, 26.9), (9.25, 28.6), (10.75, 32.0). The relationship is modelled by y = ax + b. Find a, b and Pearson's r.
- Access the GDC Statistics menu.
- Input ages into List 1 and weights into List 2.
- Execute linear regression (CALC → REG → X → ax+b).
- Read the coefficients: a = 2.4563…, b = 5.7533…
- State to 3 s.f.: a = 2.46, b = 5.75.
- Correlation coefficient: r = 0.989.
Tip: Ensure "Diagnostics On" is enabled so r appears alongside a and b.
Calculator tips
- Graph both lines and use intersect; the table shows profit for each x.
- LinReg(a+bx) on the GDC; store the equation to evaluate predictions.
Where this lesson fits
Least-squares regression line is in Unit 4 · Statistics & Probability of the IB Maths AA SL scheme of work.
- The lesson before: Presenting data: histograms, cumulative frequency & box plots (scheme-of-work lessons: Data Presentation: Histograms, Cumulative Frequency Graphs, Quartiles & Percentiles; Comparing Distributions)
- The next lesson: Conditional probability (scheme-of-work lessons: Conditional Probability; Conditional Probability Formally & Testing for Independence)
Lesson plan
| 0–5 min | Do now: students write down what they remember about Scatter plots & Pearson's r and Presenting data: histograms, cumulative frequency & box plots |
| 5–8 min | Share the learning objective and success criteria |
| 8–20 min | Teach: the worked example, step by step; students copy the method |
| 20–25 min | Your turn: 1 mini-whiteboard question; check every board before moving on |
| 25–42 min | Practise: the worksheet (6 questions in 3 levels, with school plans and the teacher trial) or the topic's practice questions online; move up a level after two right in a row |
| 42–47 min | Plenary: 1-question exit ticket; collect it to plan the next lesson |
For students: practise this topic
The worksheet's QR code opens your course's practice questions:
- IB Maths AA SL Unit 4: Bivariate Data and Correlation practice questions
- IB Maths AI SL Unit 4: Bivariate Data practice questions
With a school plan
Set Least-squares regression line as homework marked by AI, print this lesson's levelled worksheet with answers, and rebuild the lesson for your class with Create lesson. Free for 30 days as a teacher, no card.
Is it free, can I edit the slides, what do students use for homework? See questions teachers ask.