Free IB Maths AA SL lesson: Modelling with sinusoidal functions
A ready-to-teach IB Maths AA SL lesson on Modelling with sinusoidal functions (Unit 3 · Geometry & Trigonometry): editable slides and teacher notes, free; a printable worksheet in 3 levels with answers for school plans. About 55 minutes.
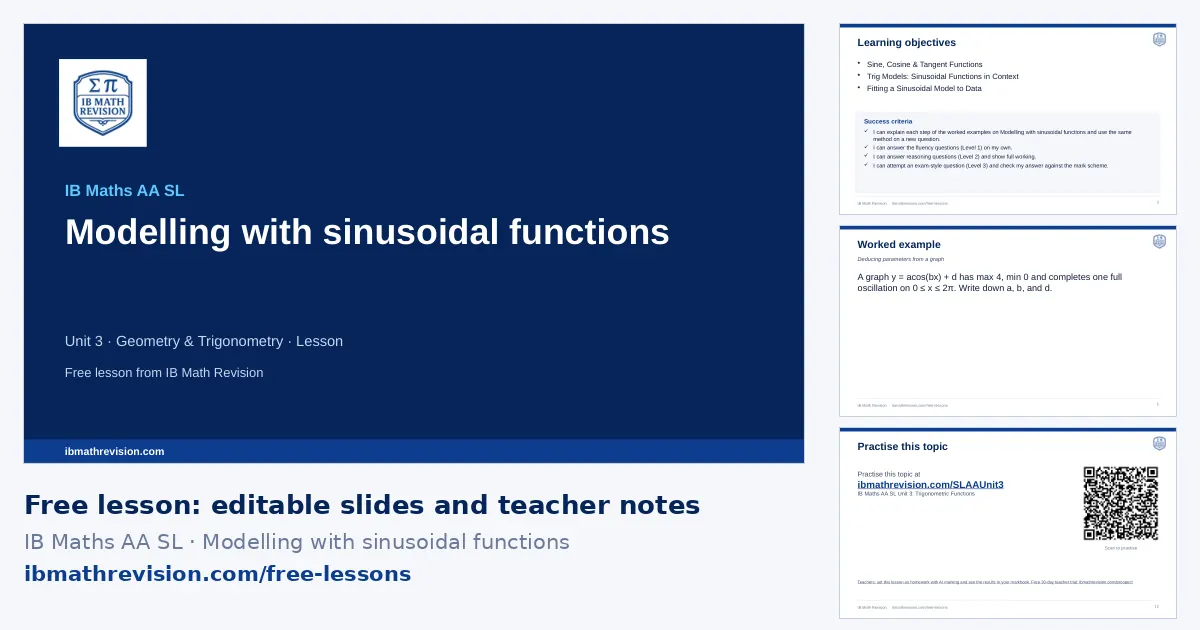
Free with a teacher account. Sign in with Google, Microsoft or email and download the slides and teacher notes.
What's inside
- Slides (PowerPoint, editable) · freeabout 12 slides: do now, objectives, key ideas, a worked example step by step, “your turn”, practice QR code, exit ticket
- Teacher notes (PDF) · freelesson plan with timings, common mistakes, homework links
- Worksheet (PDF) · school plans5 questions, 30 marks: Fluency, Reasoning, Exam-style. Included with school plans and the teacher trial.
- Answers (PDF) · school plansthe answer to every worksheet question, from its mark scheme. Included with school plans and the teacher trial.
Learning objectives
- Sine, Cosine & Tangent Functions
- Trig Models: Sinusoidal Functions in Context
- Fitting a Sinusoidal Model to Data
Key ideas on the slides
- A periodic quantity is modelled by y = asin(b(t − c)) + d or y = acos(b(t − c)) + d.
- d = the mean level (principal axis), a = (max − min)/2, b = 2π/period (or 360°/period in degrees).
- A cosine model starts at a maximum when c = 0; a sine model starts on the principal axis going up.
- Answer "when" questions with the graph (intersections) and give every time in the domain, in context.
By the end of the lesson, students should be able to answer a question like: Model tide height h(t) = 5 + 2cos(πt/6); find h(3).
Key vocabulary
- sinusoidal model: A model shaped like a sine or cosine wave.
- period: The time for one complete cycle.
- principal axis: The line y = d about which the wave oscillates.
Common mistakes this lesson tackles
- Using the period as b.
- Mixing degree and radian mode.
- Giving only the first time when the model reaches a value.
The worked example
A graph y = acos(bx) + d has max 4, min 0 and completes one full oscillation on 0 ≤ x ≤ 2π. Write down a, b, and d.
- Amplitude: a = (4−0)/2 = 2.
- Principal axis: d = (4+0)/2 = 2.
- Period: 2π = 2π/b ⇒ b = 1.
Tip: The y-intercept of asin(bx)+d equals d, but for acos(bx)+d it equals d+a (starts at max). Don't confuse the two.
Calculator tips
- SinReg fits a model to data; graph the model and use intersect for "when" questions.
Where this lesson fits
Modelling with sinusoidal functions is in Unit 3 · Geometry & Trigonometry of the IB Maths AA SL scheme of work.
- The lesson before: Volume & surface area of 3D solids (scheme-of-work lessons: 3D geometry: distance, midpoint, volume and surface area)
- The next lesson: Sampling techniques & bias (scheme-of-work lessons: Sampling Methods & Bias; Sampling Techniques & Reliability)
Lesson plan
| 0–5 min | Do now: students write down what they remember about Volume & surface area of 3D solids and Trig graphs: amplitude, period, phase shift |
| 5–8 min | Share the learning objective and success criteria |
| 8–20 min | Teach: the worked example, step by step; students copy the method |
| 20–25 min | Your turn: 1 mini-whiteboard question; check every board before moving on |
| 25–42 min | Practise: the worksheet (5 questions in 3 levels, with school plans and the teacher trial) or the topic's practice questions online; move up a level after two right in a row |
| 42–47 min | Plenary: 1-question exit ticket; collect it to plan the next lesson |
For students: practise this topic
The worksheet's QR code opens the IB Maths AA SL Unit 3: Trigonometric Functions practice questions.
With a school plan
Set Modelling with sinusoidal functions as homework marked by AI, print this lesson's levelled worksheet with answers, and rebuild the lesson for your class with Create lesson. Free for 30 days as a teacher, no card.
Is it free, can I edit the slides, what do students use for homework? See questions teachers ask.