Home › IB Maths AI SL › Exam practice › Graphing Linear, Quadratic, Exponential and Logarithmic Functions

IB Maths AI SL · Unit 2

Graphing Linear, Quadratic, Exponential and Logarithmic Functions: AI SL exam practice with markscheme

Covers key features of graphs & intersections with technology; vertical shifts / stretches; horizontal shifts / stretches; combined transformations. Work through the 10 questions on paper as if it were the exam, then open each solution and mark your work against the markscheme.

10 questions · 38 marks · about 43 minutes · 7 Paper 1 style, 3 Paper 2 style

Download the PDF 7 pages, worked solutions after the questions

Question 1

2 marks · Paper 2 style · calculator allowed

Use your calculator to find the coordinates of the point where the graphs of y=3e−0.5x and y=x meet. [2]

Show solution

(1.45, 1.45) A1A1

Graphs of y = 3e^(−0.5x) and y = x meeting at one point, (1.45, 1.45).
Intersection (1.45, 1.45)

Answer: (1.45, 1.45)

Question 2

3 marks · Paper 1 style · calculator allowed

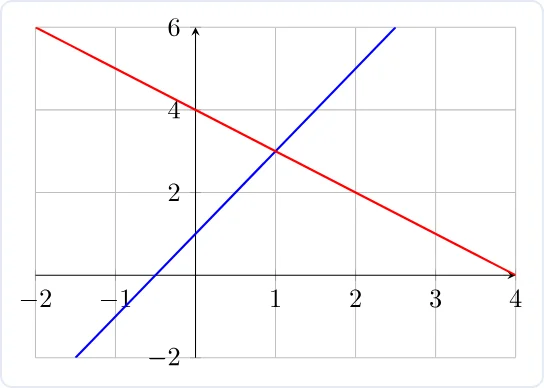
The graphs of two linear functions, L1:y=2x+1 and L2:y=−x+4, are shown below.

Diagram for Question 2

By solving the equation 2x+1=−x+4 algebraically, find the exact coordinates of their point of intersection.

[3]

Show solution

Collect x-terms on one side: 2x+x=4−1⟹3x=3 M1
x=1 A1
Substitute x=1 into L1: y=2(1)+1=3
Point of intersection: (1,3) A1

Answer: (1,3)

Question 3

3 marks · Paper 2 style · calculator allowed

Let f(x)=x3−3x2−9x+5. Use technology to answer the following.

  1. Write down the y-intercept of the graph of f. [1]

  2. Find the coordinates of the local maximum point. [1]

  3. Find the coordinates of the local minimum point. [1]

Show solution
  1. (0,5) A1

  2. (−1,10) A1

  3. (3,−22) A1

Graph of f(x) = x³ − 3x² − 9x + 5: y-intercept (0, 5), local maximum (−1, 10) and local minimum (3, −22).
Maximum (−1, 10); minimum (3, −22)

Answer: (a) (0,5); (b) (−1,10); (c) (3,−22)

Question 4

3 marks · Paper 1 style · calculator allowed

The graph of y=x2 is transformed to the graph of y=(x−2)2+3.

(a) Describe the transformation. [2]

(b) Write down the coordinates of the vertex of the new graph. [1]

Show solution

(a)

translation A1

by (23) A1

(b)

(2,3) A1

The graph of y = x² (grey) and y = (x − 2)² + 3 (blue): a translation 2 right and 3 up, moving the vertex to (2, 3).
Vertex (2, 3)

Answer: (b) (2,3)

Question 5

5 marks · Paper 1 style · calculator allowed

The graph of a quadratic function y=x2−2x−3 is shown below.

  1. Write down the coordinates of the x-intercepts.

  2. Write down the equation of the axis of symmetry.

  3. Find the exact coordinates of the vertex.
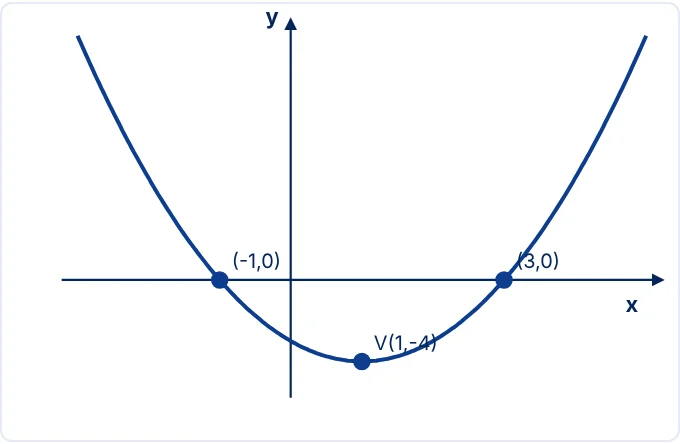
Diagram for Question 5

[5]

Show solution
  1. x-intercepts at (−1,0) and (3,0). A1A1

  2. Axis of symmetry is exactly halfway between roots: x=−1+32=1. (M1)A1

  3. Vertex x=1. y=(1)2−2(1)−3=−4. Vertex is (1,−4). A1

Answer: (a) (−1,0),(3,0); (b) x=1; (c) (1,−4)

Question 6

4 marks · Paper 1 style · calculator allowed

The point (4,−1) lies on the graph of y=f(x).

(a) Write down the image of this point on the graph of y=3f(x). [1]

(b) Write down the image of this point on the graph of y=f(x2). [1]

(c) Describe the transformation in part (b). [2]

Show solution

(a)

(4,−3) A1

(b)

(8,−1) A1

(c)

horizontal stretch A1

scale factor 2 A1

Answer: (a) (4,−3); (b) (8,−1)

Question 7

4 marks · Paper 1 style · calculator allowed

The graph of y=2x is reflected in the x-axis and then translated 4 units up.

(a) Write down the equation of the new graph. [1]

(b) Find the x-intercept of the new graph. [2]

(c) Write down the equation of its horizontal asymptote. [1]

Show solution

(a)

y=4−2x A1

(b)

2x=4 (M1)

x=2 A1

(c)

y=4 A1

The graph of y = 2ˣ (grey) and of y = 4 − 2ˣ (blue), its reflection in the x-axis moved 4 up. It crosses the x-axis at 2 and approaches y = 4 as x decreases.
x-intercept 2; asymptote y = 4

Answer: (a) y=4−2x; (b) 2; (c) y=4

Question 8

4 marks · Paper 1 style · calculator allowed

Let f(x)=ln⁡(x+3).

(a) Write down the domain of f. [1]

(b) Write down the equation of the vertical asymptote. [1]

(c) Find the x-intercept and the y-intercept. [2]

Show solution

(a)

x>−3 A1

(b)

x=−3 A1

(c)

(−2,0) A1

(0, 1.10) A1

Graph of f(x) = ln(x + 3) for x > −3, with the vertical asymptote x = −3, the x-intercept (−2, 0) and the y-intercept (0, 1.10).
Asymptote x = −3

Answer: (a) x>−3; (b) x=−3; (c) (−2,0) and (0, 1.10)

Question 9

5 marks · Paper 2 style · calculator allowed

Let f(x)=x3−6x+2.

(a) Use your calculator to find the zeros of f. [3]

(b) Find the coordinates of the local maximum point. [2]

Show solution

(a)

x=−2.60 A1

x=0.340 A1

x=2.26 A1

(b)

(−1.41, 7.66) A1A1

Graph of f(x) = x³ − 6x + 2 with zeros at −2.60, 0.340 and 2.26 and a local maximum at (−1.41, 7.66).
Zeros −2.60, 0.340, 2.26

Answer: (a) x=−2.60, 0.340, 2.26; (b) (−1.41, 7.66)

Question 10

5 marks · Paper 1 style · calculator allowed

Let f(x)=−2x2+8x−3.

(a) Find the coordinates of the vertex. [2]

(b) Use your calculator to find the x-intercepts. [2]

(c) Write down the range of f. [1]

Show solution

(a)

x=−82(−2)=2 (M1)

(2,5) A1

(b)

x=0.419 A1

x=3.58 A1

(c)

f(x)≤5 A1

Graph of f(x) = −2x² + 8x − 3 with vertex (2, 5), the highest point, and x-intercepts 0.419 and 3.58. The range is f(x) ≤ 5.
Vertex (2, 5); range f(x) ≤ 5

Answer: (a) (2,5); (b) x=0.419 and x=3.58; (c) f(x)≤5

How the marks work: M marks are for a correct method, A marks for an accurate answer that follows it, R marks for a reason, and AG means the answer is given in the question. A mark in brackets, like (M1), can be implied by later correct work.

Notes, worked examples and more questions on this topic: AI SL Graphing Linear, Quadratic, Exponential and Logarithmic Functions. Previous topic: Functions: Domain, Range & Inverses. Next topic: Linear Modelling. Every AI SL topic.

Revise first with the AI SL revision notes, then finish on real papers: IB Maths AI SL past papers.