Free IB Maths AA SL lesson: Venn diagrams & combined events
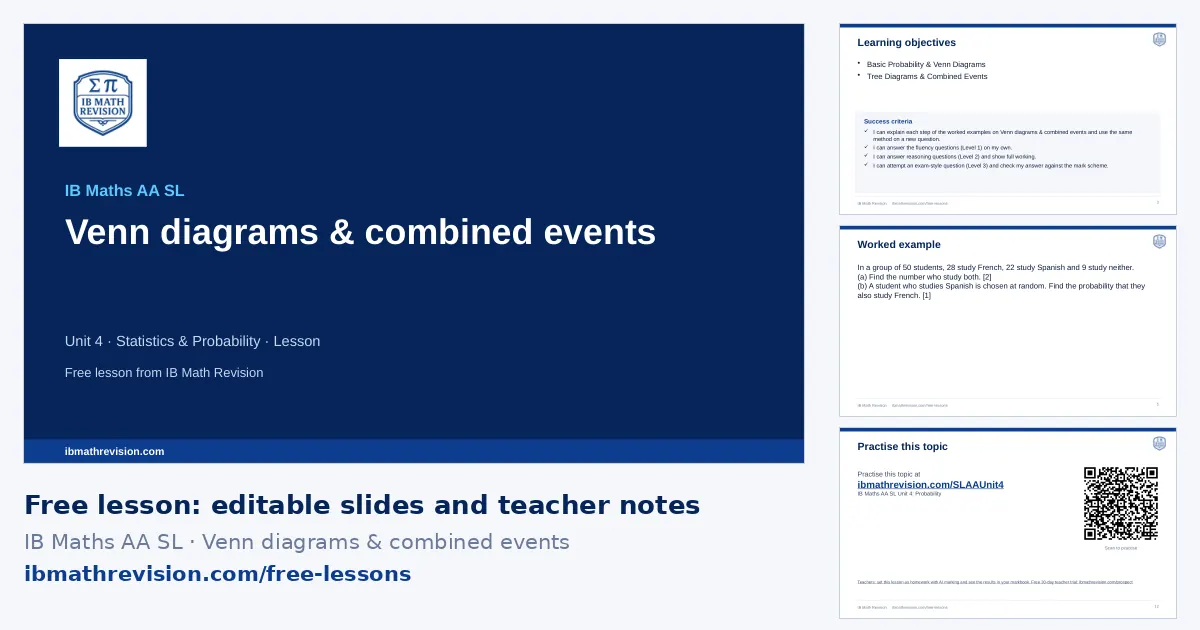
A ready-to-teach IB Maths AA SL lesson on Venn diagrams & combined events (Unit 4 · Statistics & Probability): editable slides and teacher notes, free; a printable worksheet in 3 levels with answers for school plans. About 55 minutes.
Free with a teacher account. Sign in with Google, Microsoft or email and download the slides and teacher notes.
What's inside
- Slides (PowerPoint, editable) · freeabout 12 slides: do now, objectives, key ideas, a worked example step by step, “your turn”, practice QR code, exit ticket
- Teacher notes (PDF) · freelesson plan with timings, common mistakes, homework links
- Worksheet (PDF) · school plans6 questions, 23 marks: Fluency, Reasoning, Exam-style. Included with school plans and the teacher trial.
- Answers (PDF) · school plansthe answer to every worksheet question, from its mark scheme. Included with school plans and the teacher trial.
Learning objectives
- Basic Probability & Venn Diagrams
- Tree Diagrams & Combined Events
Key ideas on the slides
- n(A) is the number of elements of A; x ∈ A means x is an element of A; A ⊂ B means every element of A is in B; ∅ is the empty set.
- Fill a Venn diagram from the middle outwards: the intersection first, then the rest of each set, then the outside.
- n(A ∪ B) = n(A) + n(B) − n(A ∩ B).
- P(A′) = 1 − P(A); P(A ∪ B) = P(A) + P(B) − P(A ∩ B).
By the end of the lesson, students should be able to answer a question like: Using a Venn diagram, find P(A U B) if P(A)=0.6 and P(B)=0.4.
Key vocabulary
- intersection: The elements in both sets, A ∩ B.
- union: The elements in either set or both, A ∪ B.
- complement: The elements not in the set, A′.
- sample space: The set of all possible outcomes.
- event: A set of outcomes.
Common mistakes this lesson tackles
- Probability: assuming independence, and conditional probability with complements. Only multiply when independence is given or proved. Find P(A ∩ B) from the addition rule or a Venn diagram, then use P(A | B) = P(A ∩ B)/P(B), writing the events in context.
- Putting the whole of n(A) in the left-hand region, so the overlap is counted twice.
- Mixing up ∪ and ∩.
- Forgetting the region outside both circles when the total is given.
Calculator tips
- No GDC step needed; fractions keep answers exact.
Where this lesson fits
Venn diagrams & combined events is in Unit 4 · Statistics & Probability of the IB Maths AA SL scheme of work.
- The lesson before: Inverse normal (finding cut-off values) (scheme-of-work lessons: Finding Probabilities & Inverse Normal; Finding an Unknown Mean or Standard Deviation)
- The next lesson: Informal limits (scheme-of-work lessons: Limits and differentiation from first principles)
Lesson plan
| 0–5 min | Do now: students write down what they remember about Inverse normal (finding cut-off values) and Normal distribution (probability lookups) |
| 5–8 min | Share the learning objective and success criteria |
| 8–20 min | Teach: the worked example, step by step; students copy the method |
| 20–25 min | Your turn: 1 mini-whiteboard question; check every board before moving on |
| 25–42 min | Practise: the worksheet (6 questions in 3 levels, with school plans and the teacher trial) or the topic's practice questions online; move up a level after two right in a row |
| 42–47 min | Plenary: 1-question exit ticket; collect it to plan the next lesson |
For students: practise this topic
The worksheet's QR code opens the IB Maths AA SL Unit 4: Probability practice questions.
With a school plan
Set Venn diagrams & combined events as homework marked by AI, print this lesson's levelled worksheet with answers, and rebuild the lesson for your class with Create lesson. Free for 30 days as a teacher, no card.
Is it free, can I edit the slides, what do students use for homework? See questions teachers ask.