Free IB Maths AA SL lesson: Logarithmic graphs & solving log equations
A ready-to-teach IB Maths AA SL lesson on Logarithmic graphs & solving log equations (Unit 2 · Functions): editable slides and teacher notes, free; a printable worksheet in 3 levels with answers for school plans. About 55 minutes.
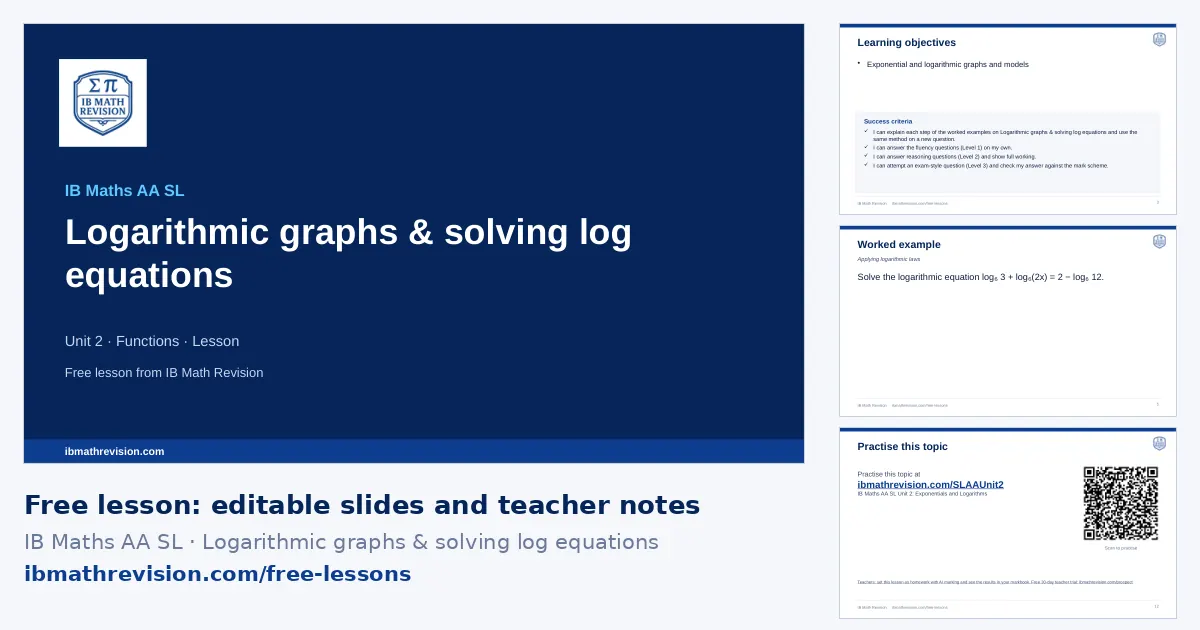
Free with a teacher account. Sign in with Google, Microsoft or email and download the slides and teacher notes.
What's inside
- Slides (PowerPoint, editable) · freeabout 12 slides: do now, objectives, key ideas, a worked example step by step, “your turn”, practice QR code, exit ticket
- Teacher notes (PDF) · freelesson plan with timings, common mistakes, homework links
- Worksheet (PDF) · school plans6 questions, 27 marks: Fluency, Reasoning, Exam-style. Included with school plans and the teacher trial.
- Answers (PDF) · school plansthe answer to every worksheet question, from its mark scheme. Included with school plans and the teacher trial.
Learning objectives
- Exponential and logarithmic graphs and models
Key ideas on the slides
- y = aˣ (a > 1) increases; y = a⁻ˣ decreases; both pass through (0, 1) with asymptote y = 0.
- y = logₐ x passes through (1, 0) with vertical asymptote x = 0; domain x > 0.
- Model N = N₀ aᵗ or N = N₀ eᵏᵗ: N₀ is the initial value; a > 1 (or k > 0) is growth, 0 < a < 1 (or k < 0) is decay.
- For y = Aeᵏˣ + c the horizontal asymptote is y = c: the long-term value of the model.
By the end of the lesson, students should be able to answer a question like: Solve the equation log₂(x) + log₂(x - 2) = 3.
Skills in this topic
Logarithmic graphs & solving log equations breaks down into 3 skills. In the worksheet builder, teachers can set practice on just one of them.
- Solving log equations with the laws of logs: Combine logs with the laws, remove the log and check the solution is in the domain.
- Log equations with different bases: Use the change of base rule to write every log in the same base before solving.
- Log graphs: domain, asymptote & intersections: Find the domain and asymptote of a log graph and where it meets another graph.
Key vocabulary
- exponential model: A model where the quantity is multiplied by a constant factor in each equal time step.
- horizontal asymptote: A horizontal line the graph approaches as x → ∞ (or −∞).
- parameter: A constant in a model (such as A or k) found from data.
- logarithm: logₐ b is the power a must be raised to to give b.
- natural logarithm: ln x, the logarithm to base e.
Common mistakes this lesson tackles
- Thinking y = e⁻ˣ crosses the x-axis.
- Reading the long-term value as 0 when the model has +c.
- Using t in months when the model is in years.
- log(a + b) = log a + log b (false: logs split products, not sums).
The worked example
Solve the logarithmic equation log₆ 3 + log₆(2x) = 2 − log₆ 12.
- Group all logarithmic terms on the left side of the equation: log₆ 3 + log₆(2x) + log₆ 12 = 2.
- Apply the product law of logarithms (log a + log b = log(ab)) to combine the terms: log₆(3 × 2x × 12) = 2.
- Simplify the argument of the logarithm: log₆(72x) = 2.
- Convert the logarithmic equation into its exponential form: 6² = 72x.
- Simplify the constant: 36 = 72x.
- Solve for x: x = 36/72 = 0.5.
Tip: A very common trap is incorrectly "adding" the arguments instead of multiplying them when applying the log addition rule. Remember, logs are exponents, so adding them corresponds to multiplying the bases!
Calculator tips
- Plot the model and use intersect for "when" questions; use exponential regression on data.
- Use the log key with base (logₐb) or change of base; check a solution by substituting it into the original equation.
Where this lesson fits
Logarithmic graphs & solving log equations is in Unit 2 · Functions of the IB Maths AA SL scheme of work.
- The lesson before: Rational functions & asymptotes (scheme-of-work lessons: Reciprocal Graphs & Asymptotes; Graphing y = (ax+b)/(cx+d); Solving Rational Equations)
- The next lesson: Composite functions (f∘g) (scheme-of-work lessons: Composite functions)
Lesson plan
| 0–5 min | Do now: students write down what they remember about Exponential graphs & modelling and Rational functions & asymptotes |
| 5–8 min | Share the learning objective and success criteria |
| 8–20 min | Teach: the worked example, step by step; students copy the method |
| 20–25 min | Your turn: 1 mini-whiteboard question; check every board before moving on |
| 25–42 min | Practise: the worksheet (6 questions in 3 levels, with school plans and the teacher trial) or the topic's practice questions online; move up a level after two right in a row |
| 42–47 min | Plenary: 1-question exit ticket; collect it to plan the next lesson |
For students: practise this topic
The worksheet's QR code opens the IB Maths AA SL Unit 2: Exponentials and Logarithms practice questions.
With a school plan
Set Logarithmic graphs & solving log equations as homework marked by AI, print this lesson's levelled worksheet with answers, and rebuild the lesson for your class with Create lesson. Free for 30 days as a teacher, no card.
Is it free, can I edit the slides, what do students use for homework? See questions teachers ask.